
Page 145 - GHES-2-2
P. 145
Global Health Econ Sustain The influence of coverage expansion
2.2. Dependent variable and covariates
For decomposition analysis, the covariates used are listed
in Table 1. Hospitalization costs for each episode were
derived from the National Health Insurance Claims Data
Analysis Manual issued by the Health Insurance Review
Agency.
Efforts are made to incorporate covariates in the health
insurance qualification data and medical institution data.
The covariates drawn from these data are sociodemographic
factors and factors related to healthy aging, such as time
to death and length of stay. In addition, variables related
to healthcare providers’ characteristics are included, all of
which are observable variables in the secondary data.
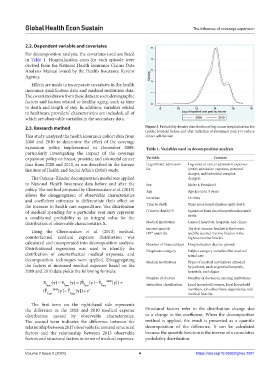
2.3. Research method Figure 3. Probability density distribution of log cancer hospitalization fee
(public burden) before and after initiation of abatement policy to reduce
This study analyzed the health insurance cohort data from cancer self-burden
2008 and 2010 to determine the effect of the coverage
expansion policy implemented in December 2009, Table 1. Variables used in decomposition analysis
particularly investigating the impact of the coverage
expansion policy on breast, prostate, and colorectal cancer Variable Content
data from 2008 and 2010, as was described in the Korean Logarithmic admission Log value of cancer admission expenses
Institute of Health and Social Affairs (2016) study. fee (entire admission expenses, personal
charges, and industrial complex
The Oaxaca–Blinder decomposition model was applied charges)
to National Health Insurance data before and after the Sex Male=1; Female=0
policy. The method proposed by Chernozukov et al. (2013) Age Age group in 5 years
allows the disaggregation of observable characteristics Location 16 cities
and coefficient estimates to differentiate their effect on
the increase in health-care expenditure. The distribution Time to death Time since hospitalization until death
of medical spending for a particular year may represent (Time to death)^2 Squares of time since hospitalization until
a conditional probability as an integral value for the death
distribution of observable characteristics X. Medical institution General hospitals, hospitals, and clinics
Income quintile The first-income bracket is the lowest,
Using the Chernozukov et al. (2013) method, (10 quantile) and the second-income bracket is the
th
counterfactual medical expense distribution was highest-income bracket
calculated and incorporated into decomposition analysis. Number of financial days Hospitalization days by episode
Distributional regression was used to identify the Diagnostic category Subject category variables that received
distribution of counterfactual medical expenses, and actual care
decomposition techniques were applied. Disaggregating Medical institutions Types of medical institutions attended
the factors of increased medical expenses based on the by patients, such as general hospitals,
2008 and 2010 data yields the following formula: hospitals, and clinics
Number of doctors Number of doctors in nursing institutions
(y) − F (y) = F ˆ [y] F ˆ 2008 [y]) +
−(F
Y 2010 Y 2008 Y 2010 Y 2010 Subscriber classification Local household owners, local household
ˆ 2008 [y] − (F ˆ [y]) + F ε members, job subscribers, dependents, and
Y 2010 Y 2008 medical benefits
The first term on the right-hand side represents
the difference in the 2008 and 2010 medical expense Structural factors refer to the distribution change due
distribution caused by observable characteristics. to a change in the coefficient. When the decomposition
The second term indicates the difference between the method is applied, the result is presented as a quantile
relationship between 2017 observable factors and structural decomposition of the difference. It can be calculated
factors and the relationship between 2013 observable because the quantile function is the inverse of a cumulative
factors and structural factors in terms of medical expenses. probability distribution.
Volume 2 Issue 2 (2024) 4 https://doi.org/10.36922/ghes.2001