
Page 144 - GHES-2-2
P. 144
Global Health Econ Sustain The influence of coverage expansion
to the lowest extent. Therefore, the study suggests that the Figure 2 shows the change in probability density of log
coverage expansion improved income-related equality self-burden hospitalization expense for cancer. According
in health-care utilization. On the other hand, Kim et al. to the graph, the 2010 self-burden curve has shifted to the
(2014) who also employed a DID methodology, found that left, indicating that the self-burden level has decreased
cost-sharing reduction from 10% to 5% for cancer patients since 2008, after the policy was ratified.
did not significantly affect equity in health-care utilization.
The mixed results have called for the attention of more Figure 3 portrays the distribution of log patient
extensive research. The study hypothesizes that the changes medical expenses paid by the National Health Insurance
in medical expenses due to coverage expansion policies since the activation of the coverage expansion policy.
would impact differently based on the initial distribution The distribution of logarithmic hospitalization costs paid
of medical costs. by the insurer seems higher in 2010 than in 2008. Also,
when comparing the peak of the two curves, the 2010
This study is distinguished from earlier studies in terms public burden is higher than that of 2008. In addition, at
of the following characteristics: a relatively high medical expense level, the 2010 curve
(1) This study does not investigate the effect of policy is higher than the 2008 curve, suggesting that the 2010
on medical expenditure by income level but by each weight of public burden has increased.
group’s initial medical expenditure level.
(2) Most empirical analyses focus on the effect of private
medical insurance on medical use, but this study
focuses on national insurance data.
(3) This study controls for descriptive variables that could
influence the policy’s effect on medical expenditure.
2. Data and methods
2.1. Data
A sample cohort of 100,000 is selected randomly from
a pool of 2002 National Health Insurance members
and medical benefit recipients. The health insurance
qualification and insurance claim data from 2002 to 2013
were collected. For this particular research, data from 2008
and 2010 were selected. These data were used to investigate
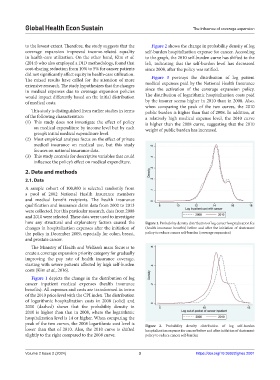
how any structural and explanatory factors caused the Figure 1. Probability density distribution of log cancer hospitalization fee
changes in hospitalization expenses after the initiation of (health insurance benefits) before and after the initiation of abatement
the policy in December 2009, especially for colon, breast, policy to reduce cancer self-burden (coverage expansion)
and prostate cancer.
The Ministry of Health and Welfare’s main focus is to
create a coverage expansion priority category for gradually
improving the pay rate of health insurance coverage,
starting with severe patients affected by high self-burden
costs (Kim et al., 2016).
Figure 1 depicts the change in the distribution of log
cancer inpatient medical expenses (health insurance
benefits). All expenses and costs are transformed in terms
of the 2010 price level with the CPI index. The distribution
of logarithmic hospitalization costs in 2008 (solid) and
2010 (dashed) shows that the probability density in
2010 is higher than that in 2008, where the logarithmic
hospitalization level is 14 or higher. When comparing the
peak of the two curves, the 2008 logarithmic cost level is Figure 2. Probability density distribution of log self-burden
lower than that of 2010. Also, the 2010 curve is shifted hospitalization expense for cancer before and after initiation of abatement
slightly to the right compared to the 2008 curve. policy to reduce cancer self-burden
Volume 2 Issue 2 (2024) 3 https://doi.org/10.36922/ghes.2001