
Page 152 - GHES-2-2
P. 152
Global Health Econ Sustain Disparities in cancer outcomes
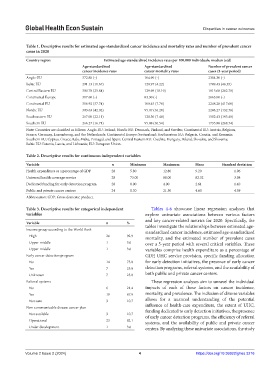
Table 1. Descriptive results for estimated age‑standardized cancer incidence and mortality rates and number of prevalent cancer
cases in 2020
Country region Estimated age‑standardized incidence rates per 100.000 individuals, median (std)
Age‑standardized Age‑standardized Number of prevalent cancer
cancer incidence rates cancer mortality rates cases (5‑year period)
Anglo-EU 372.80 (-) 104.90 (-) 2304.30 (-)
Baltic EU 291.13 (11.67) 120.97 (4.22) 1789.43 (46.35)
Central Eastern EU 300.78 (25.84) 129.98 (18.10) 1815.68 (262.78)
Continental Europe 317.60 (-) 83.30 (-) 2663.00 (-)
Continental EU 316.92 (37.74) 100.45 (7.70) 2248.28 (417.60)
Nordic EU 303.63 (42.02) 95.07 (16.20) 2286.27 (132.76)
Southeastern EU 267.00 (22.11) 128.30 (7.48) 1502.43 (193.48)
Southern EU 266.27 (16.71) 95.88 (10.54) 1735.88 (268.74)
Note: Countries are classified as follows: Anglo-EU: Ireland; Nordic EU: Denmark, Finland, and Sweden; Continental EU: Austria, Belgium,
France, Germany, Luxembourg, and the Netherlands; Continental Europe: Switzerland; Southeastern EU: Bulgaria, Croatia, and Romania;
Southern EU: Cyprus, Greece, Italy, Malta, Portugal, and Spain; Central Eastern EU: Czechia, Hungary, Poland, Slovakia, and Slovenia;
Baltic EU: Estonia, Latvia, and Lithuania; EU: European Union.
Table 2. Descriptive results for continuous independent variables
Variable n Minimum Maximum Mean Standard deviation
Health expenditure as a percentage of GDP 28 5.80 12.80 9.20 1.96
Universal health coverage service 28 73.00 88.00 82.32 3.98
Dedicated funding for early detection program 28 0.00 4.00 2.61 1.40
Public and private cancer centers 24 0.30 21.50 4.60 4.59
Abbreviation: GDP: Gross domestic product.
Table 3. Descriptive results for categorical independent Tables 4-6 showcase linear regression analyses that
variables explore univariate associations between various factors
and key cancer-related metrics for 2020. Specifically, the
Variable n % tables investigate the relationships between estimated age-
Income group according to the World Bank standardized cancer incidence, estimated age-standardized
High 26 92.9 mortality, and the estimated number of prevalent cases
Upper-middle 1 3.6 over a 5-year period with several critical variables. These
Upper-middle 1 3.6 variables comprise health expenditure as a percentage of
Early cancer detection program GDP, UHC service provision, specific funding allocation
No 14 75.0 for early detection initiatives, the presence of early cancer
Yes 7 25.0 detection programs, referral systems, and the availability of
Unknown 7 25.0 both public and private cancer centers.
Referral systems These regression analyses aim to unravel the individual
No 6 21.4 impacts of each of these factors on cancer incidence,
Yes 19 67.9 mortality, and prevalence. The inclusion of diverse variables
Not sure 3 10.7 allows for a nuanced understanding of the potential
Non-communicable disease cancer plan influence of health-care expenditure, the extent of UHC,
funding dedicated to early detection initiatives, the presence
Not available 3 10.7 of early cancer detection programs, the efficiency of referral
Operational 23 82.1 systems, and the availability of public and private cancer
Under development 1 3.6 centers. By analyzing these univariate associations, the study
Volume 2 Issue 2 (2024) 4 https://doi.org/10.36922/ghes.3216