
Page 109 - GHES-2-3
P. 109
Global Health Economics and
Sustainability
Social support and quality of life in Indian elderly
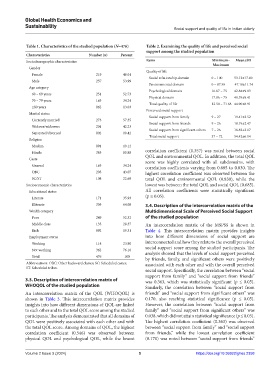
Table 1. Characteristics of the studied population (N=476) Table 2. Examining the quality of life and perceived social
support among the studied population
Characteristics Number (n) Percent
Sociodemographic characteristics Items Minimum– Mean±SD
Maximum
Gender
Quality of life
Female 219 46.01
Social relationship domain 0 – 100 53.12±17.60
Male 257 53.99
Environmental domain 0 – 87.50 47.18±11.74
Age category
Psychological domain 16.67 – 75 42.84±9.83
60 – 69 years 251 52.73
Physical domain 17.86 – 75 40.55±9.41
70 – 79 years 163 34.24
Total quality of life 12.50 – 71.88 44.90±8.91
≥80 years 062 13.03
Perceived social support
Marital status
Social support from family 9 – 27 19.41±3.52
Currently married 273 57.35
Widows/widowers 201 42.23 Social support from friends 9 – 26 18.19±2.47
Social support from significant others 7 – 26 16.82±3.07
Separated/divorced 002 00.42
Total social support 37 – 72 54.42±6.14
Religion
Muslim 091 19.12
Hindu 385 80.88 correlation coefficient (0.357) was noted between social
Caste QOL and environmental QOL. In addition, the total QOL
score was highly correlated with all subdomains, with
General 163 34.24 correlation coefficients varying from 0.685 to 0.830. The
OBC 205 43.07 highest correlation coefficient was observed between the
SC/ST 108 22.69 total QOL and environmental QOL (0.830), while the
Socioeconomic characteristics lowest was between the total QOL and social QOL (0.685).
Educational status All correlation coefficients were statistically significant
Literate 171 35.93 (p ≤ 0.05).
Illiterate 305 64.08 3.4. Description of the intercorrelation matrix of the
Wealth category Multidimensional Scale of Perceived Social Support
Poor 249 52.32 of the studied population
Middle class 135 28.37 An intercorrelation matrix of the MSPSS is shown in
Rich 092 19.31 Table 4. This intercorrelation matrix provides insights
Employment status into how different dimensions of social support are
Working 114 23.90 interconnected and how they relate to the overall perceived
Not working 362 76.10 social support score among the studied participants. The
analysis showed that the levels of social support perceived
Total 476 100 by friends, family, and significant others were positively
Abbreviations: OBC: Other backward classes; SC: Scheduled castes; associated with each other and with the overall perceived
ST: Scheduled tribes.
social support. Specifically, the correlation between “social
support from family” and “social support from friends”
3.3. Description of intercorrelation matrix of was 0.363, which was statistically significant (p ≤ 0.05).
WHOQOL of the studied population Similarly, the correlation between “social support from
An intercorrelation matrix of the QOL (WHOQOL) is friends” and “social support from significant others” was
shown in Table 3. This intercorrelation matrix provides 0.170, also reaching statistical significance (p ≤ 0.05).
insights into how different dimensions of QOL are linked However, the correlation between “social support from
to each other and to the total QOL score among the studied family” and “social support from significant others” was
participants. The analysis demonstrated that all domains of 0.038, which did not attain statistical significance (p ≤ 0.05).
QOL were positively associated with each other and with The highest correlation coefficient (0.363) was observed
the total QOL score. Among domains of QOL, the highest between “social support from family” and “social support
correlation coefficient (0.546) was observed between from friends,” while the lowest correlation coefficient
physical QOL and psychological QOL, while the lowest (0.170) was noted between “social support from friends”
Volume 2 Issue 3 (2024) 5 https://doi.org/10.36922/ghes.2358