
Page 110 - GHES-2-3
P. 110
Global Health Economics and
Sustainability
Social support and quality of life in Indian elderly
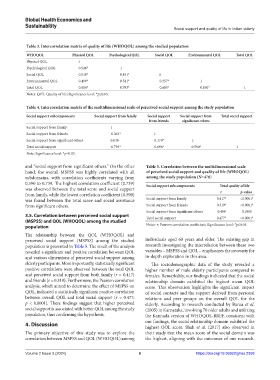
Table 3. Intercorrelation matrix of quality of life (WHOQOL) among the studied population
WHOQOL Physical QOL Psychological QOL Social QOL Environmental QOL Total QOL
Physical QOL 1
Psychological QOL 0.546* 1
Social QOL 0.510* 0.451* 1
Environmental QOL 0.499* 0.541* 0.357* 1
Total QOL 0.804* 0.793* 0.685* 0.830* 1
Notes: QOL: Quality of life; Significance level: *p≤0.05.
Table 4. Intercorrelation matrix of the multidimensional scale of perceived social support among the study population
Social support subcomponents Social support from family Social support Social support from Total social support
from friends significant others
Social support from family 1
Social support from friends 0.363* 1
Social support from significant others 0.038 0.170* 1
Total social support 0.739* 0.696* 0.590* 1
Note: Significance level: *p≤0.05.
and “social support from significant others.” On the other Table 5. Correlation between the multidimensional scale
hand, the overall MSPSS was highly correlated with all of perceived social support and quality of life (WHOQOL)
subdomains, with correlation coefficients varying from among the study population (N=476)
0.590 to 0.739. The highest correlation coefficient (0.739) Social support subcomponents Total quality of life
was observed between the total score and social support r p‑value
from family, while the lowest correlation coefficient (0.590)
was found between the total score and social assistance Social support from family 0.417* <0.0001*
from significant others. Social support from friends 0.319* <0.0001*
Social support from significant others 0.409 0.1080
3.5. Correlation between perceived social support Total social support 0.477* <0.0001*
(MSPSS) and QOL (WHOQOL) among the studied
population Notes: r: Pearson correlation coefficient; Significance level: *p≤0.05.
The relationship between the QOL (WHOQOL) and
perceived social support (MSPSS) among the studied individuals aged 60 years and older. The existing gap in
population is presented in Table 5. The result of the analysis research investigating the interrelation between these two
revealed a significant and positive correlation between QOL variables – MSPSS and QOL – emphasizes the necessity for
and various dimensions of perceived social support among in-depth exploration in this area.
elderly participants. More importantly, statistically significant The sociodemographic data of the study revealed a
positive correlations were observed between the total QOL higher number of male elderly participants compared to
and perceived social support from both family (r = 0.417) females. Remarkably, our findings indicated that the social
and friends (r = 0.319). Furthermore, the Pearson correlation relationship domain exhibited the highest mean QOL
analysis, which aimed to determine the effect of MSPSS on score. This observation highlights the significant impact
QOL, indicated a statistically significant positive correlation of social contacts and the support derived from personal
between overall QOL and total social support (r = 0.477; relations and peer groups on the overall QOL for the
p < 0.0001). These findings suggest that higher perceived elderly. According to research conducted by Barua et al.
social support is associated with better QOL among the study (2005) in Karnataka, involving 70 older adults and utilizing
population, thus confirming the hypothesis. the Kannada version of WHOQOL-BREF, consistent with
our findings, the social relationship domain exhibited the
4. Discussion highest QOL score. Shah et al. (2017) also observed in
The primary objective of this study was to explore the their study that the mean score of the social domain was
correlation between MSPSS and QOL (WHOQOL) among the highest, aligning with the outcomes of our research.
Volume 2 Issue 3 (2024) 6 https://doi.org/10.36922/ghes.2358