
Page 151 - GHES-2-3
P. 151
Global Health Economics and
Sustainability
Parenting in a changing climate
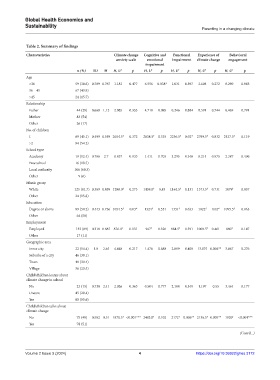
Table 2. Summary of findings
Characteristics Climate change Cognitive and Functional Experience of Behavioral
anxiety scale emotional impairment climate change engagement
impairment
n (%) SD M H, U † p H, U † p H, U † p H, U † p H, U † p
Age
<36 59 (38.6) 0.709 0.767 1.181 0.477 6.556 0.038* 1.031 0.597 2.604 0.272 0.290 0.865
36 – 45 67 (43.8)
>45 24 (15.7)
Relationship
Father 44 (29) 0.668 1.12 2.085 0.353 4.718 0.095 0.246 0.884 0.591 0.744 0.469 0.791
Mother 83 (54)
Other 26 (17)
No. of children
1 69 (45.1) 0.499 0.549 2654.5 † 0.372 2638.5 † 0.335 2256.5 † 0.02* 2799.5 † 0.832 2437.5 † 0.119
>2 84 (54.2)
School type
Academy 19 (12.4) 0.766 2.7 0.437 0.933 1.411 0.703 3.295 0.348 0.214 0.975 2.387 0.496
Free school 16 (10.5)
Local authority 106 (69.3)
Other 9 (6)
Ethnic group
White 125 (81.7) 0.369 0.839 1288.0 † 0.273 1459.0 † 0.83 1164.5 † 0.131 1373.5 † 0.731 1079 † 0.057
Other 24 (15.8)
Education
Degree or above 89 (58.2) 0.443 0.736 1054.5 † 0.03* 1324 † 0.551 1331 † 0.633 1022 † 0.02* 1095.5 † 0.063
Other 64 (58)
Employment
Employed 133 (89) 0.318 0.887 876.0 † 0.131 967 † 0.326 984.5 † 0.391 1000.5 † 0.461 880 † 0.147
Other 17 (11)
Geographic area
Inner city 22 (14.4) 1.0 2.65 4.448 0.217 1.476 0.688 2.899 0.408 13.075 0.004** 3.867 0.276
Suburbs of a city 46 (30.1)
Town 48 (30.4)
Village 36 (23.5)
Child/children learns about
climate change in school
No 23 (15) 0.738 2.41 2.026 0.363 0.504 0.777 2.104 0.349 1.197 0.55 3.464 0.177
Unsure 45 (29.4)
Yes 85 (55.6)
Child/children talks about
climate change
No 75 (49) 0.502 0.51 1870.5 <0.001*** 2483.0 † 0.102 2172 † 0.006** 2136.5 0.005** 1920 † <0.001***
†
†
Yes 78 (51)
(Cont’d...)
Volume 2 Issue 3 (2024) 4 https://doi.org/10.36922/ghes.3172