Page 152 - GHES-2-4
P. 152

Global Health Economics and
            Sustainability
                                                                               Impact of dating violence on mental health


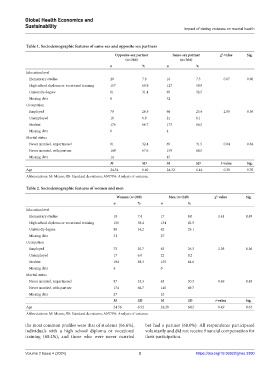
            Table 1. Sociodemographic features of same‑sex and opposite‑sex partners
                                                  Opposite‑sex partner    Same‑sex partner     χ ‑value   Sig.
                                                                                               2
                                                      (n=264)                 (n=264)
                                                n            %          n           %
            Education level
             Elementary studies                 20           7.8        16          7.5         0.07      0.96
             High school diploma or vocational training  157  60.9      127         59.9
             University degree                  81           31.4       69          32.5
             Missing data                       6                       52
            Occupation
             Employed                           70           26.5       66          25.4        2.05      0.36
             Unemployed                         18           6.8        21          8.1
             Student                            176          66.7       173         66.5
             Missing data                       0                       4
            Marital status
             Never married, unpartnered         81           32.4       69          31.5        0.04      0.84
             Never married, with partner        169          67.6       150         68.5
             Missing data                       14                      45
                                                M            SD         M           SD         t‑value    Sig.
            Age                                 24.54        6.60       24.32       6.44        0.38      0.70
            Abbreviations: M: Means; SD: Standard deviations; ANOVA: Analysis of variance.

            Table 2. Sociodemographic features of women and men

                                                   Women (n=288)         Men (n=240)        χ ‑value      Sig.
                                                                                             2
                                                 n          %        n           %
            Education level
             Elementary studies                  19         7.4      17          8.0          1.41        0.49
             High school diploma or vocational training  150  58.4   134         62.9
             University degree                   88         34.2     62          29.1
             Missing data                        31                  27
            Occupation
             Employed                            73         25.7     63          26.3         2.05        0.36
             Unemployed                          17         6.0      22          9.2
             Student                             194        68.3     155         64.6
             Missing data                        4                   0
            Marital status
             Never married, unpartnered          87         33.3     63          30.3         0.49        0.48
             Never married, with partner         174        66.7     145         69.7
             Missing data                        27                  32
                                                 M          SD       M           SD          t‑value      Sig.
            Age                                  24.56      6.92     24.28       6.02         0.49        0.63
            Abbreviations: M: Means; SD: Standard deviations; ANOVA: Analysis of variance.

            the most common profiles were that of students (66.6%),   but had a partner (68.0%). All respondents participated
            individuals with a high school diploma or vocational   voluntarily and did not receive financial compensation for
            training (60.4%), and those who were never married   their participation.


            Volume 2 Issue 4 (2024)                         3                        https://doi.org/10.36922/ghes.3300
   147   148   149   150   151   152   153   154   155   156   157