
Page 156 - GHES-2-4
P. 156
Global Health Economics and
Sustainability
Impact of dating violence on mental health
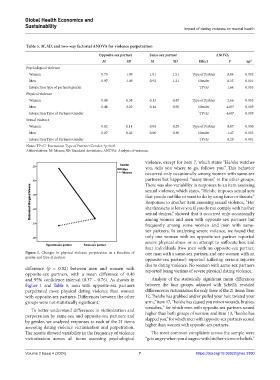
Table 5. M, SD, and two‑way factorial ANOVA for violence perpetration
Opposite‑sex partner Same‑sex partner ANOVA
M SD M SD Effect F ηp 2
Psychological violence
Women 0.75 1.09 1.01 1.51 Type of Partner 0.84 0.002
Men 0.97 1.49 0.92 1.21 Gender 0.33 0.001
Interaction type of partner×gender TP×G 1.64 0.003
Physical violence
Women 0.08 0.38 0.13 0.49 Type of Partner 2.66 0.005
Men 0.48 2.02 0.14 0.50 Gender 4.85* 0.009
Interaction Type of Partner×Gender TP×G 4.68* 0.009
Sexual violence
Women 0.02 0.14 0.04 0.29 Type of Partner 0.07 0.000
Men 0.07 0.42 0.06 0.30 Gender 1.47 0.003
Interaction Type of Partner×Gender TP×G 0.29 0.001
Notes: TP×G: Interaction Type of Partner×Gender. *p<0.05.
Abbreviations: M: Means; SD: Standard deviations; ANOVA: Analysis of variance.
violence, except for item 7, which states “He/she watches
you, tells you where to go, follows you.” This behavior
occurred only occasionally among women with same-sex
partners but happened “many times” in the other groups.
There was also variability in responses to an item assessing
sexual violence, which states, “He/she imposes sexual acts
that you do not like or want to do by using force or threats.”
Responses to another item assessing sexual violence, “He/
she threatens to leave you if you do not comply with his/her
sexual desires,” showed that it occurred only occasionally
among women and men with opposite-sex partners but
frequently among some women and men with same-
sex partners. In analyzing severe violence, we found that
only one woman with an opposite-sex partner reported
severe physical abuse or an attempt to suffocate her, and
four individuals (two men with an opposite-sex partner,
Figure 1. Changes in physical violence perpetration as a function of one man with a same-sex partner, and one woman with an
gender and type of partner
opposite-sex partner) reported suffering serious injuries
due to dating violence. No women with same-sex partners
difference (p = 0.02) between men and women with reported being victims of severe physical dating violence.
opposite-sex partners, with a mean difference of 0.40
and 95% confidence interval (0.37 – 0.76). As shown in Analysis of the statistically significant mean differences
Figure 1 and Table 5, men with opposite-sex partners between the four groups, adjusted with Scheffé, revealed
perpetrated more physical dating violence than women differences in victimization for only three of the 21 items: Item
with opposite-sex partners. Differences between the other 12, “he/she has grabbed and/or pulled your hair, twisted your
groups were not statistically significant. arm.;” item 17, “he/she has caused you minor wounds, bruises,
scratches.,” for which men with opposite-sex partners scored
To better understand differences in victimization and
perpetration by same-sex and opposite-sex partners and higher than both groups of women; and item 13, “he/she has
slapped you,” for which men with opposite-sex partners scored
by gender, we analyzed responses to each of the 21 items higher than women with opposite-sex partners.
assessing dating violence victimization and perpetration.
The results showed variability in the frequency of violence The most common complaints across the sample were
victimization across all items assessing psychological “gets angry when you disagree with his/her views or beliefs,”
Volume 2 Issue 4 (2024) 7 https://doi.org/10.36922/ghes.3300