Page 158 - GHES-2-4
P. 158

Global Health Economics and
            Sustainability
                                                                               Impact of dating violence on mental health


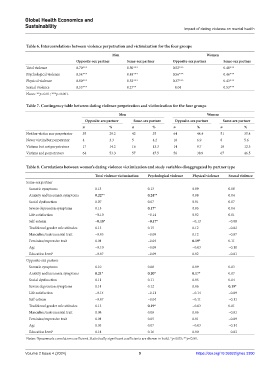
            Table 6. Intercorrelations between violence perpetration and victimization for the four groups
                                                 Men                                     Women
                                 Opposite‑sex partner  Same‑sex partner    Opposite‑sex partner  Same‑sex partner
            Total violence       0.70***               0.50***             0.52***              0.48***
            Psychological violence  0.54***            0.48***             0.56***              0.46***
            Physical violence    0.80***               0.52***             0.37***              0.43***
            Sexual violence      0.53***               0.27**              −0.04                0.53***
            Notes: **p<0.01; ***p<0.001.

            Table 7. Contingency table between dating violence perpetration and victimization for the four groups

                                                    Men                                  Women
                                     Opposite‑sex partner  Same‑sex partner  Opposite‑sex partner  Same‑sex partner
                                    n           %        n        %        n         %         n         %
            Neither victim nor perpetrator  35  29.2     42       35       64        44.4      51        35.4
            Never victim but perpetrator  4     3.3      5        4.2      10        6.9       8         5.6
            Victims but not perpetrators  17    14.2     16       13.3     14        9.7       18        12.5
            Victims and perpetrators  64        53.3     57       47.5     56        38.9      67        46.5


            Table 8. Correlations between women’s dating violence victimization and study variables disaggregated by partner type
                                         Total violence victimization  Psychological violence  Physical violence  Sexual violence
            Same-sex partner
             Somatic symptoms            0.13                   0.13               0.09           0.00
             Anxiety and insomnia symptoms  0.22**              0.24**             0.08           0.04
             Social dysfunction          0.07                   0.07               0.01           0.07
             Severe depression symptoms  0.15                   0.17*              0.05           0.04
             Life satisfaction           −0.10                  −0.14              0.02           0.01
             Self-esteem                 −0.18*                 −0.17*             −0.13          −0.08
             Traditional gender role attitudes  0.15            0.15               0.12           −0.02
             Masculine/instrumental trait  −0.05                −0.09              0.12           −0.07
             Feminine/expressive trait   0.04                   −0.04              0.19*          0.11
             Age                         −0.10                  −0.09              −0.03          −0.10
             Education level a           −0.07                  −0.09              0.02           −0.01
            Opposite-sex partner
             Somatic symptoms            0.10                   0.08               0.09           0.03
             Anxiety and insomnia symptoms  0.21*               0.20*              0.17*          0.07
             Social dysfunction          0.11                   0.11               0.05           0.04
             Severe depression symptoms  0.14                   0.12               0.06           0.19*
             Life satisfaction           −0.14                  −0.11              −0.14          −0.09
             Self-esteem                 −0.07                  −0.04              −0.11          −0.11
             Traditional gender role attitudes  0.15            0.19*              −0.03          0.01
             Masculine/instrumental trait  0.08                 0.08               0.06           −0.01
             Feminine/expressive trait   0.04                   0.05               0.01           −0.09
             Age                         0.03                   0.07               −0.03          −0.14
             Education level a           0.14                   0.16               0.00           −0.03
            Notes:  Spearman’s correlation coefficient. Statistically significant coefficients are shown in bold. *p<0.05; **p<0.01.
                 a

            Volume 2 Issue 4 (2024)                         9                        https://doi.org/10.36922/ghes.3300
   153   154   155   156   157   158   159   160   161   162   163