
Page 161 - GHES-2-4
P. 161
Global Health Economics and
Sustainability
Impact of dating violence on mental health
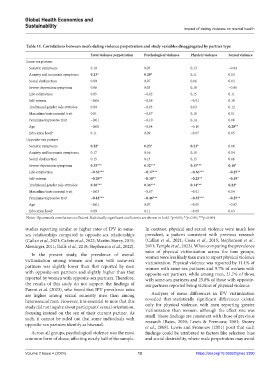
Table 11. Correlations between men’s dating violence perpetration and study variables disaggregated by partner type
Total violence perpetration Psychological violence Physical violence Sexual violence
Same-sex partner
Somatic symptoms 0.10 0.05 0.13 −0.04
Anxiety and insomnia symptoms 0.23* 0.20* 0.11 0.03
Social dysfunction 0.09 0.07 0.06 0.03
Severe depression symptoms 0.06 0.03 0.10 −0.06
Life satisfaction 0.05 −0.02 0.15 0.11
Self-esteem −0.06 −0.08 −0.01 0.10
Traditional gender role attitudes 0.00 −0.03 0.03 0.12
Masculine/instrumental trait 0.01 −0.07 0.18 0.01
Feminine/expressive trait −0.01 −0.10 0.14 0.06
Age −0.08 −0.04 −0.10 0.29**
Education level a 0.11 0.09 −0.07 0.05
Opposite-sex partner
Somatic symptoms 0.22* 0.23* 0.21* 0.06
Anxiety and insomnia symptoms 0.17 0.16 0.18 0.04
Social dysfunction 0.15 0.13 0.15 0.06
Severe depression symptoms 0.35*** 0.32*** 0.35*** 0.18*
Life satisfaction −0.38*** −0.37*** −0.36*** −0.25**
Self-esteem −0.29** −0.30** −0.25** −0.19*
Traditional gender role attitudes 0.36*** 0.34*** 0.34*** 0.22*
Masculine/instrumental trait −0.03 −0.07 −0.01 0.04
Feminine/expressive trait −0.42*** −0.46*** −0.35*** −0.25**
Age −0.01 0.07 −0.05 −0.07
Education level a 0.09 0.11 −0.09 0.03
Notes: Spearman’s correlation coefficient. Statistically significant coefficients are shown in bold. *p<0.05; **p<0.01; ***p<0.001.
a
studies reporting similar or higher rates of IPV in same- In contrast, physical and sexual violence were much less
sex relationships compared to opposite-sex relationships prevalent, a pattern consistent with previous research
(Callan et al., 2021; Cañete et al., 2022; Martin-Storey, 2015; (Callan et al., 2021; Costa et al., 2015; Stephenson et al.,
Messinger, 2011; Rollè et al., 2018; Stephenson et al., 2022). 2011; Temple et al., 2023). When comparing the prevalence
rates of physical victimization across the four groups,
In the present study, the prevalence of overall women were less likely than men to report physical violence
victimization among women and men with same-sex victimization. Physical violence was reported by 11.1% of
partners was slightly lower than that reported by men women with same-sex partners and 9.7% of women with
with opposite-sex partners and slightly higher than that opposite-sex partners, while among men, 21.7% of those
reported by women with opposite-sex partners. Therefore, with same-sex partners and 25.8% of those with opposite-
the results of this study do not support the findings of sex partners reported being victims of physical violence.
Parent et al. (2023), who found that IPV prevalence rates
are higher among sexual minority men than among Analyses of mean differences in IPV victimization
heterosexual men. However, it is essential to note that this revealed that statistically significant differences existed
study did not inquire about participants’ sexual orientation, only for physical violence, with men reporting greater
focusing instead on the sex of their current partner. As victimization than women, although the effect size was
such, it cannot be ruled out that some individuals with small. These findings are consistent with those of previous
research (Bates, 2020; Lewis & Fremouw, 2001; Shorey
opposite-sex partners identify as bisexual.
et al., 2008). Lewis and Fremouw (2001) posit that such
Across all groups, psychological violence was the most findings could be attributed to factors like selection bias
common form of abuse, affecting nearly half of the sample. and social desirability, where male perpetrators may avoid
Volume 2 Issue 4 (2024) 12 https://doi.org/10.36922/ghes.3300