
Page 172 - GHES-2-4
P. 172
Global Health Economics and
Sustainability
Evaluation of mental health law in Chile
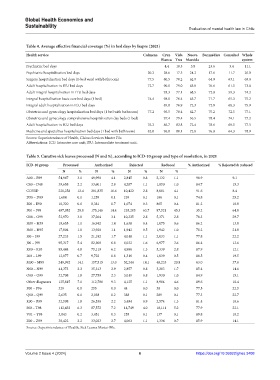
Table 4. Average effective financial coverage (%) in bed days by Isapre (2021)
Health service Colmena Cruz Vida Nueva Banmédica Consalud Whole
Blanca Tres Masvida system
Psychiatric bed days 4.4 18.3 5.8 23.6 3.4 11.1
Psychiatric hospitalization bed days 20.2 28.6 17.5 24.2 17.6 11.7 20.0
Surgery hospitalization bed days (1-bed ward with bathroom) 77.5 80.5 70.2 62.9 64.9 63.1 69.8
Adult hospitalization in ITU bed days 72.7 90.0 79.0 63.0 76.6 61.5 73.8
Adult integral hospitalization in ITU bed days 93.3 77.1 68.5 72.8 59.3 74.2
Integral hospitalization basic care bed days (1 bed) 74.4 98.0 76.4 65.7 71.7 65.3 75.2
Integral adult hospitalization in ICU bed days 89.8 76.9 72.3 72.0 68.3 75.9
Obstetrics and gynecology hospitalization bed days (1 bed with bathroom) 77.2 96.5 78.4 62.7 75.2 72.5 77.1
Obstetrics and gynecology comprehensive hospitalization day beds (1 bed) 97.4 79.4 56.5 78.4 74.1 77.2
Adult hospitalization in ICU bed days 76.2 86.7 82.8 72.4 78.6 68.5 77.5
Medicine and specialties hospitalization bed days (1 bed with bathroom) 82.8 96.8 80.1 72.8 76.8 64.3 78.9
Source: Superintendence of Health, Claims Services Master File.
Abbreviations: ICU: Intensive care unit; ITU: Intermediate treatment unit.
Table 5. Curative sick leaves processed (N and %), according to ICD‑10 group and type of resolution, in 2021
ICD‑10 group Processed Authorized Rejected Reduced % Authorized % Rejected & reduced
N % N % N % N %
A00 – B99 54,967 3.1 49,990 4.1 2,845 0.8 2,132 1.1 90.9 9.1
C00 – D48 39,658 2.2 33,601 2.8 4,207 1.1 1,850 1.0 84.7 15.3
COVID 220,258 12.4 201,835 16.6 10,422 2.8 8,001 4.1 91.6 8.4
D50 – D89 1,684 0.1 1,259 0.1 239 0.1 186 0.1 74.8 25.2
E00 – E90 10,320 0.6 8,381 0.7 1,074 0.3 865 0.4 81.2 18.8
F00 – F99 497,952 28.0 175,146 14.4 235,285 63.7 87,521 45.3 35.2 64.8
G00 – G99 52,970 3.0 37,264 3.1 10,335 2.8 5,371 2.8 70.3 29.7
H00 – H59 19,655 1.1 16,942 1.4 1,638 0.4 1,075 0.6 86.2 13.8
H60 – H95 17,804 1.0 13,920 1.1 1,942 0.5 1,942 1.0 78.2 21.8
I00 – I99 27,233 1.5 21,182 1.7 4,018 1.1 2,033 1.1 77.8 22.2
J00 – J99 95,317 5.4 82,308 6.8 6,032 1.6 6,977 3.6 86.4 13.6
K00 – K93 85,444 4.8 75,119 6.2 4,986 1.3 5,339 2.8 87.9 12.1
L00 – L99 12,077 0.7 9,722 0.8 1,316 0.4 1,039 0.5 80.5 19.5
M00 – M99 249,992 14.1 157,515 13.0 52,244 14.1 40,233 20.8 63.0 37.0
N00 – N99 41,373 2.3 35,313 2.9 2,857 0.8 3,203 1.7 85.4 14.6
O00 – O99 32,708 1.8 27,759 2.3 3,019 0.8 1,930 1.0 84.9 15.1
Other diagnoses 125,815 7.1 112,786 9.3 4,125 1.1 8,904 4.6 89.6 10.4
P00 – P96 329 0.0 255 0.0 44 0.0 30 0.0 77.5 22.5
Q00 – Q99 2,635 0.1 2,038 0.2 388 0.1 209 0.1 77.3 22.7
R00 – R99 32,598 1.8 26,530 2.2 3,494 0.9 2,574 1.3 81.4 18.6
S00 – T98 112,432 6.3 87,572 7.2 14,749 4.0 10,111 5.2 77.9 22.1
V01 – Y98 3,843 0.2 3,451 0.3 255 0.1 137 0.1 89.8 10.2
Z00 – Z99 38,422 2.2 33,023 2.7 4,063 1.1 1,336 0.7 85.9 14.1
Source: Superintendence of Health, Sick Leaves Master File.
Volume 2 Issue 4 (2024) 6 https://doi.org/10.36922/ghes.3408