
Page 104 - GHES-3-1
P. 104
Global Health Economics and
Sustainability
Maternal health-care service utilization
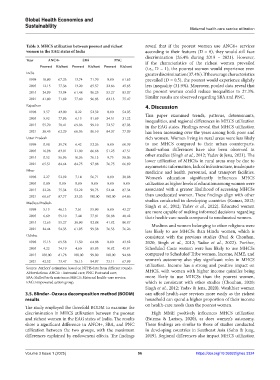
Table 3. MHCS utilization between poorest and richest reveal that if the poorest women use ANC4+ services
women in the EAG states of India according to their features (D = 0), they would still face
discrimination (26.4% during 2019 – 2021). However,
Year ANC4+ SBA PNC if the characteristics of the richest women prevailed
Poorest Richest Poorest Richest Poorest Richest (i.e., D = 1), the poorest women would experience even
India greater discrimination (37.4%). If the average characteristics
1998 10.80 67.26 13.74 71.70 0.00 61.65 prevailed (D = 0.5), the poorest would experience slightly
2005 12.15 77.36 13.20 85.57 32.66 45.85 less inequality (31.9%). Moreover, pooled data reveal that
2015 24.99 73.04 61.48 96.25 53.27 83.07 the poorest women could reduce inequalities to 27.3%.
2021 41.80 71.82 77.60 96.83 82.13 75.47 Similar results are observed regarding SBA and PNC.
Rajasthan 4. Discussion
1998 3.57 43.00 8.22 52.32 0.00 54.05
This paper examined trends, patterns, determinants,
2005 5.92 77.96 6.13 91.69 34.51 31.22 inequalities, and regional differences in MHCS utilization
2015 55.70 78.41 69.06 99.10 72.57 87.03 in the EAG states. Findings reveal that MHCS utilization
2021 30.45 62.29 66.06 96.10 84.37 77.09 has been increasing over the years among both poor and
Uttar Pradesh rich women. Women living in rural areas were less likely
1998 0.98 39.78 6.42 52.26 0.00 60.39 to use MHCS compared to their urban counterparts.
2005 16.98 83.01 21.00 86.68 51.25 47.51 Rural–urban differences have also been observed in
2015 0.52 56.96 10.36 76.13 9.75 58.06 other studies (Singh et al., 2012; Yadav & Jena, 2021). The
lower utilization of MHCSs in rural areas may be due to
2021 65.51 84.64 84.75 97.88 76.75 66.89 asymmetric information, lack of infrastructure, inadequate
Bihar medicine and health personnel, and transport facilities.
1998 2.27 52.92 7.14 56.71 0.00 38.98 Women’s education significantly influences MHCS
2005 0.00 0.00 0.00 0.00 0.00 0.00 utilization as higher levels of education among women were
2015 32.26 75.34 52.22 98.73 52.44 87.34 associated with a greater likelihood of accessing MHCSs
2021 66.67 87.77 33.33 100.00 100.00 64.86 than uneducated women. These findings align with other
Madhya Pradesh studies conducted in developing countries (Kumar, 2012;
Singh et al., 2012; Yadav et al., 2022). Educated women
1998 5.13 46.13 7.61 55.90 0.00 43.27
are more capable of making informed decisions regarding
2005 6.69 59.10 7.44 77.81 50.88 48.42 their health-care needs compared to uneducated women.
2015 12.65 55.27 38.90 92.88 41.82 80.87 Muslims and women belonging to other religions were
2021 24.44 54.33 61.95 99.38 76.53 76.26 less likely to use MHCSs than Hindu women, which is
Odisha consistent with the previous studies (Paul & Chouhan,
1998 15.13 69.58 11.50 64.88 0.00 43.82 2020; Singh et al., 2012; Yadav et al., 2022). Further,
2005 4.22 74.19 4.60 85.95 10.82 45.91 Scheduled Caste women were less likely to use MHCSs
2015 100.00 81.78 100.00 99.00 100.00 94.88 compared to Scheduled Tribe women. Income, MME, and
2021 42.52 73.47 76.13 94.97 73.11 67.99 women’s autonomy also play significant roles in MHCS
Source: Authors’ estimation based on NFHS data from different rounds. utilization. Income has a strong and positive impact on
Abbreviations: ANC4+: Antenatal care; PNC: Postnatal care; MHCS, with women with higher income quintiles being
SBA: Skilled birth assistance; MHCS: Maternal health-care service; more likely to use MHCSs than the poorest women,
EAG: Empowered action group. which is consistent with other studies (Chouhan, 2020;
Singh et al., 2012; Yadav & Jena, 2020). Wealthier women
3.5. Blinder–Oaxaca decomposition method (BODM) can afford health-care services more easily as the richest
results household can spend a higher proportion of their income
on health-care needs than the poorest women.
The study employed the threefold BODM to examine the
discrimination in MHCS utilization between the poorest High MME positively influences MHCS utilization
and richest women in the EAG states of India. The results (Fatema & Lariscy, 2020), as does women’s autonomy.
show a significant difference in ANC4+, SBA, and PNC These findings are similar to those of studies conducted
utilization between the two groups, with the maximum in developing countries in Southeast Asia (Sohn & Jung,
differences explained by endowment effects. The findings 2019). Regional differences also impact MHCS utilization
Volume 3 Issue 1 (2025) 96 https://doi.org/10.36922/ghes.3324