
Page 106 - GHES-3-1
P. 106
Global Health Economics and
Sustainability
Maternal health-care service utilization
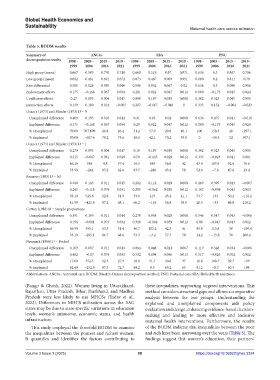
Table 5. BODM results
Summary of ANC4+ SBA PNC
decomposition results 1998 – 2005 – 2015 – 2019 – 1998 – 2005 – 2015 – 2019 – 1998 – 2005 – 2015 – 2019 –
1999 2006 2016 2021 1999 2006 2016 2021 1999 2006 2016 2021
High group (mean) 0.667 0.509 0.776 0.718 0.669 0.519 0.97 0.971 0.636 0.5 0.897 0.786
Low group (mean) 0.082 0.481 0.691 0.672 0.073 0.467 0.903 0.951 0.000 0.2 0.811 0.78
Raw differential 0.585 0.028 0.085 0.046 0.596 0.052 0.067 0.02 0.636 0.3 0.086 0.006
Endowment effects 0.175 −0.168 0.067 0.034 0.291 0.022 0.047 0.012 0.000 −0.175 0.045 0.024
Coefficient effects 0.27 0.095 0.004 0.017 0.098 0.197 0.038 0.008 0.302 0.323 0.045 0.005
Interaction effects 0.139 0.100 0.014 −0.005 0.207 −0.167 −0.018 0 0.335 0.152 −0.004 −0.023
Oaxaca (1973) and Blinder (1973) D = 0
Unexplained difference 0.409 0.195 0.018 0.012 0.31 0.03 0.02 0.008 0.636 0.475 0.041 −0.018
Explained difference 0.175 −0.168 0.067 0.034 0.29 0.022 0.047 0.012 0.000 −0.175 0.045 0.024
% Unexplained 70.00 707.600 20.8 26.4 51.2 57.9 29.8 40.1 100 158.3 48 −297.1
% Explained 30.00 −607.6 79.2 73.6 48.8 42.1 70.2 59.9 0 −58.3 52 397.1
Oaxaca (1973) and Blinder (1973) D = 1
Unexplained difference 0.270 0.095 0.004 0.017 0.10 0.197 0.038 0.008 0.302 0.323 0.045 0.005
Explained difference 0.315 −0.067 0.081 0.029 0.50 −0.145 0.029 0.012 0.335 −0.023 0.041 0.001
% Unexplained 46.10 344 4.8 37.4 16.5 380 56.6 42 47.4 107.6 52.4 76.6
% Explained 53.90 −244 95.2 62.6 83.5 −280 43.4 58 52.6 −7.6 47.6 23.4
Reimers (1983) D = 0.5
Unexplained difference 0.340 0.145 0.011 0.015 0.202 0.114 0.029 0.008 0.469 0.399 0.043 −0.007
Explained difference 0.245 −0.118 0.074 0.031 0.395 −0.062 0.038 0.012 0.167 −0.099 0.043 0.013
% Unexplained 58.10 525.8 12.8 31.9 33.8 219 43.2 41.1 73.7 133 50.2 −110.2
% Explained 41.90 −425.8 87.2 68.1 66.2 −119 56.8 58.9 26.3 −33 49.8 210.2
Cotton (1988) D = Sample proportions
Unexplained difference 0.391 0.109 0.011 0.014 0.278 0.054 0.028 0.008 0.546 0.347 0.043 −0.006
Explained difference 0.194 −0.081 0.073 0.032 0.318 −0.002 0.039 0.012 0.09 −0.047 0.043 0.012
% Unexplained 66.90 395.1 13.3 31.4 46.7 103.2 42.3 41 85.8 115.8 50 −100.4
% Explained 33.10 −295.1 86.7 68.6 53.3 −3.2 57.7 59 14.2 −15.8 50 200.4
Neumark (1988) D = Pooled
Unexplained difference 0.103 0.097 0.011 0.013 0.064 0.048 0.021 0.007 0.119 0.326 0.034 −0.006
Explained difference 0.482 −0.07 0.074 0.033 0.532 0.004 0.046 0.013 0.517 −0.026 0.052 0.012
% Unexplained 17.60 352.5 12.5 27.3 10.8 91.7 30.8 37 18.8 108.7 39.7 −99
% Explained 82.40 −252.5 87.5 72.7 89.2 8.3 69.2 63 81.2 −8.7 60.3 199
Abbreviations: ANC4+: Antenatal care; BODM: Blinder–Oaxaca decomposition method; PNC: Postnatal care; SBA: Skilled birth assistance.
(Bango & Ghosh, 2022). Women living in Uttarakhand, these inequalities, supporting targeted interventions. This
Rajasthan, Uttar Pradesh, Bihar, Jharkhand, and Madhya method considers structural gaps and allows a comparative
Pradesh were less likely to use MHCSs (Yadav et al., analysis between the two groups. Understanding the
2022). Differences in MHCS utilization across the EAG explained and unexplained components aids policy
states may be due to state-specific variations in education evaluation and design, enhancing evidence-based decision-
levels, women’s autonomy, economic status, and health making and leading to more effective and inclusive
infrastructure. maternal health interventions. Furthermore, the results
This study employed the threefold BODM to examine of the BODM indicate that inequalities between the poor
the inequalities between the poorest and richest women. and rich have been narrowing over the years (Table 5). The
It quantifies and identifies the factors contributing to findings suggest that women’s education, their partners’
Volume 3 Issue 1 (2025) 98 https://doi.org/10.36922/ghes.3324