
Page 129 - GHES-3-1
P. 129
Global Health Economics and
Sustainability
Adherence to ART among HIV patients in Cameroon
Table 1. Distribution of study participants’ characteristics
Variables Absolute value Relative frequency (%)
Age group (years)
15 – 29 73 24
30 – 44 81 26
45 – 60 155 50
Sex
Female 198 64.1
Male 111 35.9
Marital status
Single 109 35.3
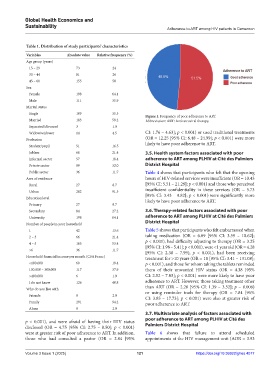
Figure 1. Frequency of poor adherence to ART
Married 183 59.2 Abbreviation: ART: Antiretroviral therapy.
Separated/divorced 3 1.0
Widow/widower 14 4.5 CI: 1.76 – 4.63]; p < 0.001) or used traditional treatments
Profession (OR = 12.25 [95% CI: 6.48 – 24.99]; p < 0.001) were more
likely to have poor adherence to ART.
Student/pupil 51 16.5
Jobless 66 21.4 3.5. Health system factors associated with poor
Informal sector 57 18.4 adherence to ART among PLHIV at Cité des Palmiers
Private sector 99 32.0 District Hospital
Public sector 36 11.7 Table 4 shows that participants who felt that the opening
Area of residence hours of HIV-related services were insufficient (OR = 10.43
Rural 27 8.7 [95% CI: 5.51 – 21.29]; p < 0.001) and those who perceived
Urban 282 91.3 insufficient confidentiality in these services (OR = 5.73
Education level [95% CI: 3.43 – 9.82]; p < 0.001) were significantly more
likely to have poor adherence to ART.
Primary 27 8.7
Secondary 84 27.2 3.6. Therapy-related factors associated with poor
University 198 64.1 adherence to ART among PLHIV at Cité des Palmiers
Number of people in your household District Hospital
1 42 13.6 Table 5 shows that participants who felt embarrassed when
2 – 3 66 21.4 taking medication (OR = 6.09 [95% CI: 3.59 – 10.62];
4 – 5 165 53.4 p < 0.001), had difficulty adjusting to therapy (OR = 3.25
[95% CI: 1.98 – 5.41]; p < 0.001), were <1 year old (OR = 4.28
>6 36 11.7 [95% CI: 2.38 – 7.99]; p < 0.001), had been receiving
Household financial income per month (CFA Franc) treatment for >10 years (OR = 18 [95% CI: 3.41 – 131.08];
<100,000 60 19.4 p < 0.001), and those for whom taking the tablets reminded
100,000 – 300,000 117 37.9 them of their unwanted HIV status (OR = 4.38 [95%
>400,000 6 1.9 CI: 2.52 – 7.83]; p < 0.001) were more likely to have poor
I do not know 126 40.8 adherence to ART. However, those taking treatment other
Who do you live with than ART (OR = 2.20 [95% CI: 1.39 – 3.52]; p = 0.008)
or using reminder tools for therapy (OR = 7.84 [95%
Friends 9 2.9 CI: 3.85 – 17.73]; p < 0.001) were also at greater risk of
Family 291 94.2 poor adherence to ART.
Alone 9 2.9
3.7. Multivariate analysis of factors associated with
poor adherence to ART among PLHIV at Cité des
p < 0.001), and were afraid of having their HIV status
disclosed (OR = 4.75 [95% CI: 2.75 – 8.50]; p < 0.001) Palmiers District Hospital
were at greater risk of poor adherence to ART. In addition, Table 6 shows that failure to attend scheduled
those who had consulted a pastor (OR = 2.84 [95% appointments at the HIV management unit (AOR = 3.93
Volume 3 Issue 1 (2025) 121 https://doi.org/10.36922/ghes.4077