
Page 130 - GHES-3-1
P. 130
Global Health Economics and
Sustainability
Adherence to ART among HIV patients in Cameroon
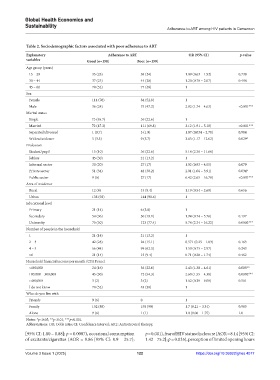
Table 2. Sociodemographic factors associated with poor adherence to ART
Explanatory Adherence to ART OR (95% CI) p‑value
variables Good (n=150) Poor (n=159)
Age group (years)
15 – 29 35 (23) 38 (24) 1.09 (0.63 – 1.92) 0.738
30 – 44 37 (25) 44 (28) 1.20 (0.70 – 2.07) 0.498
45 – 60 78 (52) 77 (48) 1
Sex
Female 114 (76) 84 (52.8) 1
Male 36 (24) 75 (47.2) 2.82 (1.74 – 4.63) <0.001***
Marital status
Single 73 (48.7) 36 (22.6) 1
Married 72 (47.3) 111 (69.8) 3.12 (1.91 – 5.18) <0.001***
Separated/divorced 1 (0.7) 3 (1.9) 1.07 (0.034 – 2.78) 0.984
Widow/widower 5 (3.3) 9 (5.7) 3.65 (1.17 – 12.62) 0.029*
Profession
Student/pupil 15 (10) 36 (22.6) 5.14 (2.36 – 11.66)
Jobless 45 (30) 21 (13.2) 1
Informal sector 30 (20) 27 (17) 1.92 (0.93 – 4.05) 0.079
Private sector 51 (34) 48 (30.2) 2.01 (1.06 – 3.91) 0.034*
Public sector 9 (6) 27 (17) 6.42 (2.65 – 16.78) <0.001***
Area of residence
Rural 12 (8) 15 (9.4) 1.19 (0.54 – 2.69) 0.656
Urban 138 (92) 144 (90.6) 1
Educational level
Primary 21 (14) 6 (3.8) 1
Secondary 54 (36) 30 (18.9) 1.94 (0.74 – 5.76) 0.197
University 75 (50) 123 (77.4) 5.74 (2.34 – 16.22) 0.0003***
Number of people in the household
1 21 (14) 21 (13.2) 1
2 – 3 42 (28) 24 (15.1) 0.571 (0.25 – 1.83) 0.163
4 – 5 66 (44) 99 (62.3) 1.50 (0.75 – 2.97) 0.243
>6 21 (14) 15 (9.4) 0.71 (0.28 – 1.74) 0.462
Household financial income per month (CFA Franc)
<100,000 24 (16) 36 (22.6) 2.43 (1.30 – 4.61) 0.005**
100,000 – 300,000 45 (30) 72 (54.3) 2.60 (1.55 – 4.38) 0.0002***
>400,000 3 (2) 3 (2) 1.62 (0.29 – 9.08) 0.561
I do not know 78 (52) 48 (30) 1
Who do you live with
Friends 9 (6) 0 1
Family 132 (88) 158 (99) 1.7 (0.21 – 3.31) 0.983
Alone 9 (6) 1 (1) 1.0 (0.06 – 1.75) 1.0
Notes: *p<0.05; **p<0.01; ***p<0.001.
Abbreviations: OR: Odds ratio; CI: Confidence interval; ART: Antiretroviral therapy.
[95% CI: 1.80 – 8.88]; p = 0.0007), occasional consumption p = 0.001), fear of HIV status disclosure (AOR = 8.14 [95% CI:
of excitants/cigarettes (AOR = 9.86 [95% CI: 0.9 – 25.7]; 1.42 – 75.2]; p = 0.035), perception of limited opening hours
Volume 3 Issue 1 (2025) 122 https://doi.org/10.36922/ghes.4077