
Page 159 - GHES-3-1
P. 159
Global Health Economics and
Sustainability
Affect heuristics in substance use
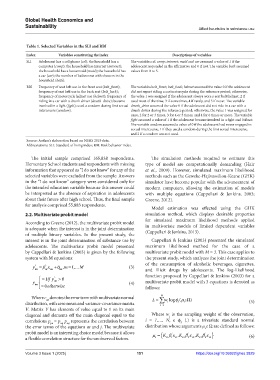
Table 1. Selected Variables in the SLI and RBI
Index Variables constituting the index Descriptions of variables
SLI Adolescent has a cell phone (cel); the household has a The variables cel; comp; internet; maid and car assumed a value of 1 if the
computer (comp); the household has Internet (internet); adolescent responded in the affirmative and 0 if not. The variable bath assumed
the household has a housemaid (maid); the household has values from 0 to 5.
a car (car); the number of bathrooms with showers in the
household (bath).
RBI Frequency of seat belt use in the front seat (belt_front); The variables belt_front; belt_back; helmet assumed the value 0 if the adolescent
frequency of seat belt use in the back seat (belt_back); did not report riding a car/motorcycle during the reference period; otherwise,
frequency of motorcycle helmet use (helmet); frequency of the value 1 was assigned if the adolescent always wore a seat belt/helmet, 2 if
riding in a car with a drunk driver (drunk_drive); became used most of the time, 3 if sometimes, 4 if rarely, and 5 if never. The variable
involved in a fight (fight); used a condom during first sexual drunk_drive assumed the value 0 if the adolescent did not ride in a car with a
intercourse (condom). drunk driver during the reference period; otherwise, the value 1 was assigned for
once, 2 for 2 or 3 times, 3 for 4 or 5 times, and 4 for 6 times or more. The variable
fight assumed a value of 1 if the adolescent became involved in a fight and 0 if not.
The variable condom assumed a value of 0 if the adolescent had never engaged in
sexual intercourse, 1 if they used a condom during the first sexual intercourse,
and 2 if a condom was not used.
Source: Author’s elaboration based on NSHS 2019 data.
Abbreviations: SLI: Standard of living index; RBI: Risk behavior index.
The initial sample comprised 165,838 respondents. The simulation methods required to estimate this
Elementary School students and respondents with missing type of model are computationally demanding (Hair
information that appeared as “I do not know” for any of the et al., 2009). However, simulated maximum likelihood
selected variables were excluded from the sample. Answers methods such as the Geweke-Hajivassiliou-Keane (GHK)
in the “I do not know” category were considered only for simulator have become popular with the advancement of
the intended education variable because this answer could modern computers, allowing the estimation of models
be interpreted as the absence of aspiration in adolescents with multiple equations (Cappellari & Jenkins, 2003;
about their future after high school. Thus, the final sample Greene, 2012).
for analysis comprised 55,883 respondents.
Model estimation was effected using the GHK
2.2. Multivariate probit model simulation method, which displays desirable properties
for simulated maximum likelihood methods applied
According to Greene (2012), the multivariate probit model in multivariate models of limited dependent variables
is adequate when the interest is in the joint determination
of multiple binary variables. In the present study, the (Cappellari & Jenkins, 2013).
interest is in the joint determination of substance use by Cappellari & Jenkins (2003) presented the simulated
adolescents. The multivariate probit model presented maximum likelihood method for the case of a
by Cappellari & Jenkins (2003) is given by the following multivariate probit model with M = 3. This case applies to
system with M equations: the present study, which analyzes the joint determination
of the consumption of alcoholic beverages, cigarettes,
x +
'
y = im β m im im ,m =ò 1,… M (3) and illicit drugs by adolescents. The log-likelihood
*
function proposed by Cappellari & Jenkins (2003) for a
*
= 1 if y > 0
y im im (4) multivariate probit model with 3 equations is denoted as
= 0 otherwise follows:
N
Where ϵ denotes the error term with multivariate normal L = ∑ w log ( ; )φµ Ω
im
distribution, with zero mean and variance-covariance matrix i= 1 i 3 i (5)
V. Matrix V has elements of value equal to 1 on its main
diagonal and elements off the main diagonal equal to the Where w is the sampling weight of the observation,
j
correlations p = p p represents the correlation between i = 1,…, N, e ϕ (.) is a trivariate standard normal
3
mj
mj
jm
the error terms of the equations m and j. The multivariate distribution whose arguments μ e Ω are defined as follows:
i
probit model is an interesting choice model because it allows µ ' xK β , ' x ,K β ' x )
a flexible correlation structure for the unobserved factors. i ( K β = 1 i 1 i 1 2 i 2 i 2 3 i 3 i 3 (6)
Volume 3 Issue 1 (2025) 151 https://doi.org/10.36922/ghes.3829