
Page 163 - GHES-3-1
P. 163
Global Health Economics and
Sustainability
Affect heuristics in substance use
peers revealed a positive relationship in model (2c). Thus, consume these substances. It also noted a significant correlation
the consumption of all substances by peers increases the between the error terms of the models estimated in Table 3,
probability of cigarette consumption among adolescents which made the parameters obtained by these models biased.
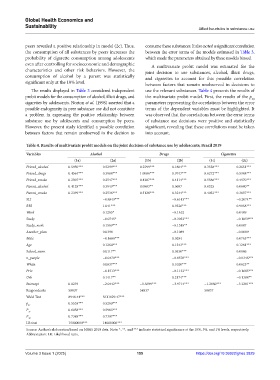
even after controlling for socioeconomic and demographic A multivariate probit model was estimated for the
characteristics and other risk behaviors. However, the joint decision to use substances, alcohol, illicit drugs,
consumption of alcohol by a parent was statistically and cigarettes to account for this possible correlation
significant only at the 10% level. between factors that remain unobserved in decisions to
The results displayed in Table 3 considered independent use the relevant substances. Table 4 presents the results of
probit models for the consumption of alcohol, illicit drugs, and the multivariate probit model. First, the results of the p
mj
cigarettes by adolescents. Norton et al. (1998) asserted that a parameters representing the correlations between the error
possible endogeneity in peer substance use did not constitute terms of the dependent variables must be highlighted. It
a problem in expressing the positive relationship between was observed that the correlations between the error terms
substance use by adolescents and consumption by peers. of substance use decisions were positive and statistically
However, the present study identified a possible correlation significant, revealing that these correlations must be taken
between factors that remain unobserved in the decision to into account.
Table 4. Results of multivariate probit models on the joint decision of substance use by adolescents; Brazil 2019
Variables Alcohol Drugs Cigarettes
(1a) (2a) (1b) (2b) (1c) (2c)
Friend_alcohol 0.5950*** 0.5299*** 0.2599*** 0.1804*** 0.3358*** 0.2651***
Friend_drugs 0.4564*** 0.3984*** 1.0086*** 0.9747*** 0.6272*** 0.5988***
Friend_smoke 0.2507*** 0.2547*** 0.4387*** 0.4114*** 0.5386*** 0.4970***
Parent_alcohol 0.4128*** 0.3949*** 0.0883** 0.0697 0.0325 0.0640**
Parent_smoke 0.2399*** 0.2536*** 0.3128*** 0.3244*** 0.4053*** 0.3837***
SLI −0.8849*** −0.6143*** −0.2074**
RBI 1.041*** 0.9526*** 0.9068***
Work 0.1265* −0.1462 0.0489
Study −0.0745* −0.3033*** −0.1859***
Study_work 0.1569*** −0.1348** 0.0087
Another_plan 0.0394 −0.1089 −0.0009
Male −0.1680*** 0.0284 0.0765***
Age 0.1260*** 0.1343*** 0.1281***
School_mom 0.0117** 0.0330*** 0.0086
n_people −0.0470*** −0.0576*** −0.0346***
White 0.0837*** 0.1020*** 0.0625**
Priv −0.1513*** −0.1133*** −0.1683***
Urb 0.1417** 0.2174*** −0.1388**
Intercept 0.0239 −2.0442*** −1.6699*** −3.9714*** −1.2060*** −3.3201***
Respondents 58837 58837 58837
Wald Test 8946.44*** 5611029.47***
p 0.5538*** 0.5260***
21
P 0.6058*** 0.5983***
31
P 0.7388*** 0.7307***
32
LR test 15000000*** 14000000***
Source: Author’s elaboration based on NSHS 2019 data. Note: *, **, and *** indicate statistical significance at the 10%, 5%, and 1% levels, respectively.
Abbreviation: LR: Likelihood ratio.
Volume 3 Issue 1 (2025) 155 https://doi.org/10.36922/ghes.3829