
Page 225 - GHES-3-1
P. 225
Global Health Economics and
Sustainability
Fatigue, quality of life, and social support in Greek health staff
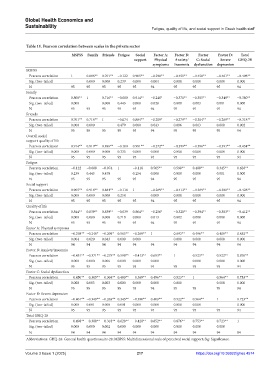
Table 11. Pearson correlation between scales in the private sector
MSPSS Family Friends Fatigue Social Factor A: Factor B: Factor Factor D: Total
support Physical Anxiety/ C: Social Severe GHQ‑28
symptoms Insomnia dysfunction depression
MSPSS
Pearson correlation 1 0.808** 0.701** −0.122 0.905** −0.298** −0.451** −0.450** −0.461** −0.498**
Sig. (two-tailed) 0.000 0.000 0.239 0.000 0.004 0.000 0.000 0.000 0.000
N 95 95 95 95 95 94 95 95 95 94
Family
Pearson correlation 0.808** 1 0.716** −0.080 0.914** −0.240* −0.371** −0.305** −0.349** −0.380**
Sig. (two-tailed) 0.000 0.000 0.443 0.000 0.020 0.000 0.003 0.001 0.000
N 95 95 95 95 95 94 95 95 95 94
Friends
Pearson correlation 0.701** 0.716** 1 −0.074 0.884** −0.209* −0.279** −0.304** −0.269** −0.318**
Sig. (two-tailed) 0.000 0.000 0.479 0.000 0.043 0.006 0.003 0.008 0.002
N 95 95 95 95 95 94 95 95 95 94
Overall social
support-quality of life
Pearson correlation 0.914** 0.919** 0.896** −0.100 0.991** −0.272** −0.399** −0.386** −0.391** −0.434**
Sig. (two-tailed) 0.000 0.000 0.000 0.335 0.000 0.008 0.000 0.000 0.000 0.000
N 95 95 95 95 95 94 95 95 95 94
Fatigue
Pearson correlation −0.122 −0.080 −0.074 1 −0.118 0.565** 0.598** 0.480** 0.345** 0.628**
Sig. (two-tailed) 0.239 0.443 0.479 0.254 0.000 0.000 0.000 0.001 0.000
N 95 95 95 95 95 94 95 95 95 94
Social support
Pearson correlation 0.905** 0.914** 0.884** −0.118 1 −0.269** −0.413** −0.369** −0.380** −0.428**
Sig. (two-tailed) 0.000 0.000 0.000 0.254 0.009 0.000 0.000 0.000 0.000
N 95 95 95 95 95 94 95 95 95 94
Quality of life
Pearson correlation 0.844** 0.839** 0.839** −0.039 0.864** −0.256* −0.320** −0.394** −0.383** −0.412**
Sig. (two-tailed) 0.000 0.000 0.000 0.710 0.000 0.013 0.002 0.000 0.000 0.000
N 95 95 95 95 95 94 95 95 95 94
Factor A: Physical symptoms
Pearson correlation −0.298** −0.240* −0.209* 0.565** −0.269** 1 0.693** 0.496** 0.409** 0.852**
Sig. (two-tailed) 0.004 0.020 0.043 0.000 0.009 0.000 0.000 0.000 0.000
N 94 94 94 94 94 94 94 94 94 94
Factor B: Anxiety/Insomnia
Pearson correlation −0.451** −0.371** −0.279** 0.598** −0.413** 0.693** 1 0.523** 0.522** 0.876**
Sig. (two-tailed) 0.000 0.000 0.006 0.000 0.000 0.000 0.000 0.000 0.000
N 95 95 95 95 95 94 95 95 95 94
Factor C: Social dysfunction
Pearson correlation −0.450** −0.305** −0.304** 0.480** −0.369** 0.496** 0.523** 1 0.564** 0.753**
Sig. (two-tailed) 0.000 0.003 0.003 0.000 0.000 0.000 0.000 0.000 0.000
N 95 95 95 95 95 94 95 95 95 94
Factor D: Severe depression
Pearson correlation −0.461** −0.349** −0.269** 0.345** −0.380** 0.409** 0.522** 0.564** 1 0.723**
Sig. (two-tailed) 0.000 0.001 0.008 0.001 0.000 0.000 0.000 0.000 0.000
N 95 95 95 95 95 94 95 95 95 94
Total GHQ-28
Pearson correlation −0.498** −0.380** −0.318** 0.628** −0.428** 0.852** 0.876** 0.753** 0.723** 1
Sig. (two-tailed) 0.000 0.000 0.002 0.000 0.000 0.000 0.000 0.000 0.000
N 94 94 94 94 94 94 94 94 94 94
Abbreviations: GHQ-28: General health questionnaire-28; MSPSS: Multidimensional scale of perceived social support; Sig: Significance.
Volume 3 Issue 1 (2025) 217 https://doi.org/10.36922/ghes.4574