
Page 87 - GHES-3-1
P. 87
Global Health Economics and
Sustainability
Impact of socio-demographics on MMR, TFR, & FP in Pakistan
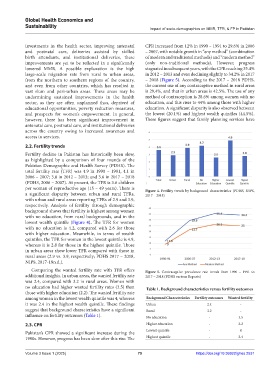
investments in the health sector, improving antenatal CPR increased from 12% in 1990 – 1991 to 29.6% in 2006
and postnatal care, deliveries assisted by skilled – 2007, with notable growth in “any method” (combination
birth attendants, and institutional deliveries, these of modern and traditional methods) and “modern method”
improvements are yet to be reflected in a significantly (only non-traditional methods). However, progress
lowered MMR. A possible explanation is the high stagnated in subsequent years, with the CPR reaching 35.4%
large-scale migration rate from rural to urban areas, in 2012 – 2013 and even declining slightly to 34.2% in 2017
from the northern to southern regions of the country, – 2018 (Figure 5). According to the 2017 – 2018 PDHS,
and even from other countries, which has resulted in the current use of any contraceptive method in rural areas
vast slum and peri-urban areas. These areas may be is 29.4%, and that in urban areas is 42.5%. The use of any
undermining sustained improvements in the health method of contraception is 28.6% among women with no
sector, as they are often unplanned thus, deprived of education, and this rises to 44% among those with higher
educational opportunities, poverty reduction measures, education. A significant disparity is also observed between
and prospects for women’s empowerment. In general, the lowest (20.1%) and highest wealth quintiles (44.5%).
however, there has been significant improvement in These figures suggest that family planning services have
antenatal care, postnatal care, and institutional deliveries
across the country owing to increased awareness and
access to services.
2.2. Fertility trends
Fertility decline in Pakistan has historically been slow,
as highlighted by a comparison of four rounds of the
Pakistan Demographic and Health Survey (PDHS). The
total fertility rate (TFR) was 4.9 in 1990 – 1991, 4.1 in
2006 – 2007; 3.8 in 2012 – 2013; and 3.6 in 2017 – 2018
(PDHS, 2006 – 2007). At present, the TFR is 3.6 children
per woman of reproductive age (15 – 49 years). There is Figure 4. Fertility trends by background characteristics (PDHS, NIPS,
a significant disparity between urban and rural TFRs, 2017 – 2018)
with urban and rural areas reporting TFRs of 2.9 and 3.9,
respectively. Analysis of fertility through demographic
background shows that fertility is highest among women
with no education, from rural backgrounds, and in the
lowest wealth quintile (Figure 4). The TFR for women
with no education is 4.2, compared with 2.6 for those
with higher education. Meanwhile, in terms of wealth
quintiles, the TFR for women in the lowest quintile is 4.9,
whereas it is 2.8 for those in the highest quintile. Those
in urban areas show lower TFR compared with those in
rural areas (2.9 vs. 3.9, respectively; PDHS 2017 – 2018,
NIPS, 2017-18n.d.).
Comparing the wanted fertility rate with TFR offers Figure 5. Contraceptive prevalence rate trends from 1990 – 1991 to
additional insights. In urban areas, the wanted fertility rate 2017 – 2018 (PDHS various Reports)
was 2.4, compared with 3.2 in rural areas. Women with
no education had higher wanted fertility rates (3.5) than Table 1. Background characteristics versus fertility outcomes
those with higher education (2.2). The wanted fertility rate
among women in the lowest wealth quintile was 4, whereas Background Characteristics Fertility outcomes Wanted fertility
it was 2.4 in the highest wealth quintile. These findings Urban 2.4 -
suggest that background characteristics have a significant Rural 3.2 -
influence on fertility outcomes (Table 1). No education - 3.5
2.3. CPR Higher education - 2.2
Pakistan’s CPR showed a significant increase during the Lowest quintile - 4
1990s. However, progress has been slow after this rise. The Highest quintile - 2.4
Volume 3 Issue 1 (2025) 79 https://doi.org/10.36922/ghes.2531