
Page 191 - GHES-3-2
P. 191
Global Health Economics and
Sustainability
Post-partum modern contraceptive use in Pakistan
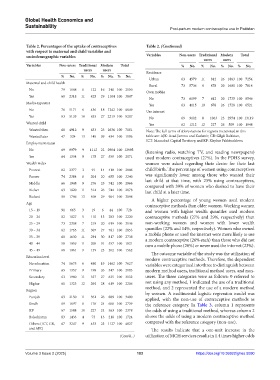
Table 2. Percentages of the uptake of contraceptives Table 2. (Continued)
with respect to maternal and child variables and
sociodemographic variables Variables Non‑users Traditional Modern Total
users users
Variables Non‑users Traditional Modern Total % No. % No. % No. % No.
users users
Residence
% No. % No. % No. % No.
Urban 63 4579 11 812 26 1863 100 7254
Maternal and child health
Rural 73 5736 6 478 20 1600 100 7814
No 79 1688 6 122 16 340 100 2150
Own mobile
Yes 60 2318 11 425 29 1104 100 3847
No 73 6199 7 612 20 1735 100 8546
Media exposure
Yes 63 4115 10 678 26 1728 100 6521
No 76 5171 6 436 18 1242 100 6849 Use internet
Yes 63 5135 10 853 27 2219 100 8207 No 69 9102 8 1063 23 2954 100 13119
Wanted child Yes 62 1212 12 227 26 509 100 1948
Wanted then 68 4912 9 633 23 1636 100 7181 Note: The full terms of abbreviations for regions mentioned in this
Wanted later 47 524 13 148 39 434 100 1106 table are: AJK: Azad Jammu and Kashmir, GB: Gilgit Baltistan,
ICT: Islamabad Capital Territory, and KP: Khyber Pakhtunkhwa.
Employment status
No 69 8979 9 1112 22 2904 100 12995 (listening radio, watching TV, and reading newspapers)
Yes 64 1334 9 178 27 559 100 2071 used modern contraceptives (27%). In the PDHS survey,
Wealth index women were asked regarding their desire for their last
Poorest 82 2377 3 91 14 418 100 2886 child/birth. The percentage of women using contraceptives
Poorer 74 2384 6 201 20 655 100 3240 was significantly lower among those who wanted their
Middle 66 1948 9 276 25 742 100 2966 last child at that time, with 23% using contraceptives,
compared with 39% of women who desired to have their
Richer 63 1820 11 314 26 744 100 2878 last child at a later time.
Richest 58 1786 13 408 29 904 100 3098
A higher percentage of young women used modern
Age
contraceptive methods than older women. Working women
15 – 19 91 665 3 19 6 44 100 728 and women with higher wealth quantiles used modern
20 – 24 82 1827 5 110 13 283 100 2220 contraceptive methods (27% and 29%, respectively) than
25 – 29 73 2308 7 219 20 619 100 3146 non-working women and women with lower wealth
30 – 34 62 1765 11 307 27 781 100 2853 quantiles (22% and 14%, respectively). Women who owned
a mobile phone or used the internet were more likely to use
35 – 39 60 1630 11 291 30 817 100 2738 a modern contraceptive (26% each) than those who did not
40 – 44 58 1059 11 205 31 557 100 1821 own a mobile phone (20%) or never used the internet (23%).
45 – 49 68 1061 9 139 23 362 100 1562
Education level The outcome variable of the study was the utilization of
modern contraceptive methods. Therefore, the dependent
No education 74 5675 6 490 19 1462 100 7627 variables were categorized into three to distinguish between
Primary 65 1357 9 199 26 547 100 2103 modern method users, traditional method users, and non-
Secondary 63 1960 11 337 27 835 100 3132 users. The three categories were as follows: 0 referred to
Higher 60 1323 12 264 28 619 100 2206 not using any method, 1 indicated the use of a traditional
method, and 2 represented the use of a modern method
Region
by women. A multinomial logistic regression model was
Punjab 63 2150 11 361 26 889 100 3400 applied, with the non-use of contraceptive methods as
Sindh 69 1897 6 176 24 666 100 2739 the reference category. In Table 3, column 1 represents
KP 67 1588 10 227 24 563 100 2378 the odds of using a traditional method, whereas column 2
Balochistan 83 1433 4 73 13 218 100 1724 shows the odds of using a modern contraceptive method
Others (ICT, GB, 67 3247 9 453 23 1127 100 4827 compared with the reference category (non-use).
and AJK) The results indicate that a one-unit increase in the
(Cont’d...) utilization of MCH services results in 1.4 times higher odds
Volume 3 Issue 2 (2025) 183 https://doi.org/10.36922/ghes.5090