
Page 192 - GHES-3-2
P. 192
Global Health Economics and
Sustainability
Post-partum modern contraceptive use in Pakistan
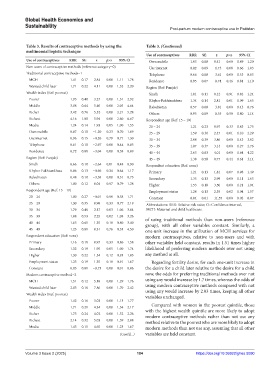
Table 3. Results of contraceptive methods by using the Table 3. (Continued)
multinomial logistic technique
Use of contraceptives RRR SE z p>z 95% CI
Use of contraceptives RRR SE z p>z 95% CI Own mobile 1.03 0.08 0.41 0.69 0.89 1.20
Non-users of contraceptive methods (reference category=0) Use internet 0.82 0.09 −1.73 0.08 0.66 1.03
Traditional contraceptive methods=1 Telephone 0.66 0.08 −3.61 0.00 0.53 0.83
MCH 1.41 0.17 2.84 0.00 1.11 1.78 Residence 0.95 0.07 −0.74 0.46 0.81 1.10
Wanted child later 1.71 0.22 4.11 0.00 1.32 2.20 Region (Ref: Punjab)
Wealth index (Ref: poorest) Sindh 1.01 0.11 0.12 0.91 0.82 1.24
Poorer 1.95 0.40 3.27 0.00 1.31 2.92 Khyber Pakhtunkhwa 1.34 0.14 2.81 0.01 1.09 1.65
Middle 3.08 0.64 5.40 0.00 2.05 4.64 Balochistan 0.57 0.08 −3.81 0.00 0.43 0.76
Richer 3.42 0.76 5.52 0.00 2.21 5.28 Others 0.95 0.09 −0.55 0.59 0.80 1.14
Richest 4.16 1.00 5.94 0.00 2.60 6.67 Respondent age (Ref: 15 – 19)
Media 1.24 0.14 1.93 0.05 1.00 1.55 20 – 24 1.21 0.23 0.97 0.33 0.83 1.75
Own mobile 0.87 0.10 −1.20 0.23 0.70 1.09 25 – 29 1.59 0.30 2.47 0.01 1.10 2.29
Use internet 0.96 0.15 −0.26 0.79 0.71 1.30 30 – 34 2.08 0.39 3.86 0.00 1.43 3.02
Telephone 0.61 0.10 −2.97 0.00 0.44 0.85 35 – 39 1.87 0.37 3.14 0.00 1.27 2.76
Residence 0.72 0.08 −3.04 0.00 0.58 0.89 40 – 44 2.63 0.63 4.01 0.00 1.64 4.22
Region (Ref: Punjab) 45 – 49 1.38 0.58 0.77 0.44 0.61 3.14
Sindh 0.66 0.10 −2.64 0.01 0.48 0.90 Respondent education (Ref: none)
Khyber Pakhtunkhwa 0.86 0.13 −0.96 0.34 0.64 1.17 Primary 1.21 0.13 1.81 0.07 0.98 1.49
Balochistan 0.48 0.10 −3.38 0.00 0.31 0.73 Secondary 1.35 0.13 2.99 0.00 1.11 1.63
Others 1.00 0.12 0.04 0.97 0.79 1.28 Higher 1.53 0.18 3.50 0.00 1.21 1.94
Respondent age (Ref: 15 – 19) Employment status 1.28 0.13 2.35 0.02 1.04 1.57
20 – 24 1.00 0.27 −0.01 0.99 0.58 1.71 Constant 0.04 0.01 −11.55 0.00 0.02 0.07
25 – 29 1.30 0.35 0.98 0.33 0.77 2.19 Abbreviations: RRR: Relative risk ratio; CI: Confidence interval,
30 – 34 1.79 0.48 2.17 0.03 1.06 3.04 MCH: Maternal and child healthcare.
35 – 39 1.88 0.53 2.25 0.02 1.08 3.26 of using traditional methods than non-users (reference
40 – 44 1.65 0.61 1.35 0.18 0.80 3.40 group), with all other variables constant. Similarly, a
45 – 49 1.23 0.81 0.31 0.76 0.33 4.50 one-unit increase in the utilization of MCH services for
Respondent education (Ref: none) modern contraceptives, relative to non-users and with
Primary 1.16 0.18 0.97 0.33 0.86 1.58 other variables held constant, results in 1.51 times higher
Secondary 1.32 0.19 1.95 0.05 1.00 1.74 likelihood of preferring modern methods over not using
Higher 1.30 0.22 1.54 0.12 0.93 1.83 any method at all.
Employment status 1.23 0.19 1.35 0.18 0.91 1.67 Regarding fertility desire, for each one-unit increase in
Constant 0.03 0.01 −8.73 0.00 0.01 0.06 the desire for a child later relative to the desire for a child
Modern contraceptive method=2 now, the odds for preferring traditional methods over not
MCH 1.51 0.12 5.18 0.00 1.29 1.76 using any would increase by 1.7 times, whereas the odds of
Wanted child later 2.03 0.18 7.86 0.00 1.70 2.42 using modern contraceptive methods compared with not
Wealth index (Ref: poorest) using any would increase by 2.03 times, keeping all other
variables unchanged.
Poorer 1.42 0.16 3.03 0.00 1.13 1.77
Middle 1.71 0.21 4.34 0.00 1.34 2.17 Compared with women in the poorest quintile, those
Richer 1.73 0.24 4.02 0.00 1.32 2.26 with the highest wealth quintile are more likely to adopt
modern contraceptive methods rather than not use any
Richest 2.14 0.32 5.03 0.00 1.59 2.88
method relative to the poorest who are more likely to adopt
Media 1.43 0.11 4.65 0.00 1.23 1.67 modern methods than not use any, assuming that all other
(Cont’d...) variables are held constant.
Volume 3 Issue 2 (2025) 184 https://doi.org/10.36922/ghes.5090