
Page 50 - GHES-3-2
P. 50
Global Health Economics and
Sustainability
Aging and health facilities in Indian cities
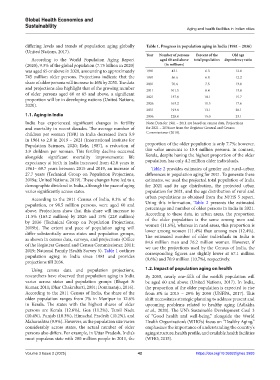
differing levels and trends of population aging globally Table 1. Progress in population aging in India (1981 – 2036)
(United Nations, 2017).
Year Number of persons Percent of the Old age
According to the World Population Aging Report aged 60 and above total population dependency ratio
(2020), 9.3% of the global population (7.75 billion in 2020) (in millions)
was aged 65 or above in 2020, amounting to approximately 1981 43.1 6.3 12.0
745 million older persons. Projections indicate that the 1991 56.6 6.8 12.2
share of older persons will increase to 16% by 2050. The data 2001 76.6 7.5 13.0
and projections also highlight that of the growing number 2011 101.5 8.4 13.8
of older persons aged 60 or 65 and above, a significant
proportion will be in developing nations (United Nations, 2021 137.9 10.1 15.7
2020). 2026 163.2 11.5 17.6
2031 193.8 13.1 20.1
1.1. Aging in India 2036 228.0 15.0 23.1
India has experienced significant changes in fertility Note: Data for 1981 – 2011 are based on census data. Projections
and mortality in recent decades. The average number of for 2021 – 2036 are from the Registrar General and Census
children per woman (TFR) in India decreased from 5.9 Commissioner (2019).
in 1961 to 2.0 in 2019 – 2021 (International Institute for
Population Sciences, 2020; Rele, 1987), a reduction of proportion of the older population is only 7.7%; however,
3.9 children per woman. This fertility decline occurred this value amounts to 15.4 million persons. In contrast,
alongside significant mortality improvements: life Kerala, despite having the highest proportion of the older
expectancy at birth in India increased from 42.0 years in population, has only 4.2 million older individuals.
1961– 69.7 years between 2015 and 2019, an increase of Table 2 provides estimates of gender and rural–urban
27.7 years (Technical Group on Population Projections, differences in population aging for 2021. To generate these
2019a; United Nations, 2019). These changes have led to a estimates, we used the projected total population of India
demographic dividend in India, although the pace of aging for 2021 and its age distribution, the projected urban
varies significantly across states. population for 2021, and the age distribution of rural and
According to the 2011 Census of India, 8.3% of the urban populations as obtained from the NFHS 5 report.
population, or 98.5 million persons, were aged 60 and Using this information, Table 2 presents the estimated
above. Projections show that this share will increase to percentage and number of older persons in India in 2021.
11.5% (163.2 million) by 2026 and 15% (228 million) According to these data, in urban areas, the proportion
by 2036 (Technical Group on Population Projections, of the older population is the same among men and
2019b). The extent and pace of population aging will women (11.6%), whereas in rural areas, this proportion is
differ substantially across states and population groups, lower among women (11.4%) than among men (12.4%).
The estimated number of older individuals in India is
as shown in census data, surveys, and projections (Office 84.6 million men and 76.2 million women. However, if
of the Registrar General and Census Commissioner, 2011; we use the projections used by the Census of India, the
2019; National Family Health Survey 5). Table 1 outlines corresponding figures are slightly lower at 67.1 million
population aging in India since 1981 and provides (9.6%) and 70.9 million (10.7%), respectively.
projections till 2036.
Using census data and population projections, 1.2. Impact of population aging on health
researchers have observed that population aging in India By 2050, nearly one-fifth of the world’s population will
varies across states and population groups (Bhagat & be aged 60 and above (United Nations, 2017). In India,
Kumar, 2011; Dhar Chakrabarti, 2001; Dommaraju, 2016). the proportion of the older population is expected to rise
According to the 2011 Census of India, the share of the from 8% in 2015 – 20% by 2050 (UNFPA, 2017). This
older population ranges from 7% in Manipur to 12.6% shift necessitates strategic planning to address present and
in Kerala. The states with the highest shares of older upcoming problems related to healthy aging (Adlakha
persons are Kerala (12.6%), Goa (11.2%), Tamil Nadu et al., 2020). The UN’s Sustainable Development Goal 3
(10.4%), Punjab (10.3%), Himachal Pradesh (10.2%), and of “Good health and well-being,” alongside the World
Maharashtra (9.9%). However, as the population size varies Health Organization’s (WHO’s) focus on “Healthy Aging,”
considerably across states, the actual number of older emphasizes the importance of understanding the country’s
persons also differs. For example, in Uttar Pradesh, India’s aging structure, health profile, and available health facilities
most populous state with 200 million people in 2011, the (WHO, 2015).
Volume 3 Issue 2 (2025) 42 https://doi.org/10.36922/ghes.3993