
Page 52 - GHES-3-2
P. 52
Global Health Economics and
Sustainability
Aging and health facilities in Indian cities
categorized by size and status. In 2001, most cities had an older population of < 8%.
The ArcGIS software was used to map the share of However, states such as Kerala, Tamil Nadu, and West
the older population across Indian cities. We projected Bengal exhibited a higher share of more than 10%. A rapid
the share of the older population for 2021 and created an increase in the older population was observed between
inventory map displaying the available health facilities 2001 and 2011 across cities. The percentage of the older
in each city and the average distance to them. Hotspot population is expected to increase above 14% in many
analysis was also performed to identify the major hotspots cities across the country. Significant concentrations of the
of aging in India. The list of indicators and subindicators older population will be observed in states such as Kerala,
used to compute the HFI is given below: Tamil Nadu, West Bengal, Punjab, Delhi, and Maharashtra
and cities such as Thiruvananthapuram, Palakkad, Hugli-
Indicators of health Subindicators used Chinsurah, Khardah, South DumDum, Uttarpara Kotrung,
facilities (Per 000 population) and Nabadwip.
1. Government Hospital a. Number of Allopathic Hospitals
2. Allopathic Government Hotspot analysis reveals the geographic hotspots for the
Hospital Alternative b. Number of beds older population in India (Figure 3). The southernmost
3. Dispensary/Health Center c. Number of doctors and eastern parts of India emerge as the primary hotspots,
4. T.B. Hospital/Clinic d. Number of paramedical staff
5. Nursing Home with a 99% confidence level. These areas house a high
6. Mobile Health Clinic proportion of the older population and are surrounded
7. Others by cities with similar numbers of older adults. Conversely,
the northern regions, including Punjab, Haryana, Uttar
3. Results
3.1. Aging pattern in Indian cities
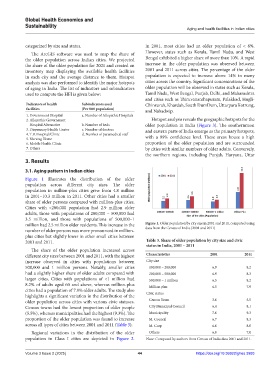
Figure 1 illustrates the distribution of the older
population across different city sizes. The older
population in million-plus cities grew from 4.8 million
in 2001–10.3 million in 2011. Other cities had a smaller
share of older persons compared with million-plus cities.
Cities with <200,000 population had 2.9 million older
adults, those with populations of 200,000 – 500,000 had
3.5 million, and those with populations of 500,000–1
million had 2.5 million older residents. This increase in the Figure 1. Older population by city size in 2001 and 2011, computed using
number of older persons was more pronounced in million- data from the Census of India (2001 and 2011)
plus cities but slightly lower in other small cities between
2001 and 2011. Table 3. Share of older population by city size and civic
status in India, 2001 – 2011
The share of the older population increased across
different city sizes between 2001 and 2011, with the highest Characteristics 2001 2011
increase observed in cities with populations between City size
500,000 and 1 million persons. Notably, smaller cities 100,000 – 200,000 6.9 8.2
had a slightly higher share of older adults compared with 200,000 – 500,000 6.9 8.3
larger cities. Cities with populations of <1 million had 500,000 – 1 million 6.5 8.2
8.2% of adults aged 60 and above, whereas million-plus Million plus 6.5 7.9
cities had a population of 7.9% older adults. The study also
highlights a significant variation in the distribution of the Civic status
older population across cities with various civic statuses. Census Town 3.6 5.5
Census towns had the lowest proportion of older people City Municipal Council 6.4 8.1
(5.5%), whereas municipalities had the highest (9.3%). The Municipality 7.6 9.3
proportion of the older population was found to increase M. Council 6.7 8.3
across all types of cities between 2001 and 2011 (Table 3). M. Corp 6.6 8.0
Regional variations in the distribution of the older Others 6.0 7.0
population in Class I cities are depicted in Figure 2. Note: Computed by authors from Census of India data 2001 and 2011.
Volume 3 Issue 2 (2025) 44 https://doi.org/10.36922/ghes.3993