
Page 145 - GHES-3-3
P. 145
Global Health Economics and
Sustainability
A comparative analysis
2011, and data concerning COVID-19 confirmed, cured, cases during COVID-19 could be systematically or non-
and death cases were from the government of India website systematically underreported.
(mygov.in). This research calculated the COVID-19 case
fatality ratio (CFR), the ratio of total COVID-19 deaths to 3. Results
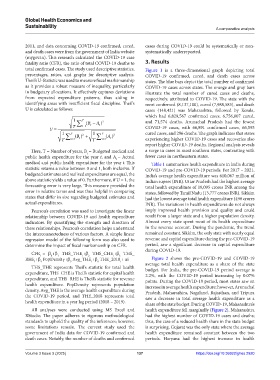
total confirmed cases. The study used descriptive statistics, Figure 1 is a three-dimensional graph depicting total
percentages, ratios, and graphs for descriptive analysis. COVID-19 confirmed, cured, and death cases across
Theil’s U-Statistic was used to measure fiscal marksmanship states. The blue bars depict the total number of confirmed
as it provides a robust measure of inequality, particularly COVID-19 cases across states. The orange and gray bars
in budgetary allocations. It effectively captures deviations illustrate the total number of cured cases and deaths,
from expected expenditure patterns, thus aiding in respectively, attributed to COVID-19. The state with the
identifying areas with insufficient fiscal discipline. Theil’s most confirmed (8,137,100), cured (7,988,585), and death
U is calculated as follows: cases (148,421) was Maharashtra, followed by Kerala,
which had 6,829,567 confirmed cases, 6,756,807 cured,
1 T ( B A ) 2 and 71,574 deaths. Arunachal Pradesh had the fewest
U T t 1 t t COVID-19 cases, with 66,891 confirmed cases, 66,595
1 T 2 1 T 2 cured cases, and 296 deaths. The graph indicates that states
t
T t 1 B () T t 1 ( A ) experiencing higher COVID-19 cases and recoveries also
t
report higher COVID-19 deaths. Regional analysis reveals
Here, T = Number of years, B = Budgeted medical and a surge in cases in most southern states, contrasting with
t
public health expenditure for the year t, and A = Actual fewer cases in northeastern states.
t
medical and public health expenditure for the year t. This Table 1 summarizes health expenditure in India during
statistic returns a value between 0 and 1, both inclusive. If COVID-19 and pre-COVID-19 periods. For 2017 – 2021,
budgeted estimates and realized expenditures are equal, the India’s average health expenditure was 610,067 million of
above statistic yields a value of 0. Furthermore, if U = 1, the Indian rupees (INR). Uttar Pradesh had the highest average
forecasting error is very large. This measure provided the total health expenditure of 19,095 crores INR among the
error in relative terms and was thus helpful in comparing states, followed by Tamil Nadu (13,777 crores INR). Sikkim
states that differ in size regarding budgeted estimates and had the lowest average total health expenditure (490 crores
actual expenditures. INR). The variations in health expenditures do not always
Pearson’s correlation was used to investigate the linear imply improved health provision and quality and could
relationship between COVID-19 and health expenditure result from a larger state and a higher population density.
indicators. By quantifying the strength and direction of Almost every state spent most of its health expenditure
these relationships, Pearson’s correlation helps understand in the revenue account. During the pandemic, the trend
the interconnectedness of various factors. A simple linear remained constant. Sikkim, the only state with nearly equal
regression model of the following form was also used to revenue and capital expenditure during the pre-COVID-19
determine the impact of fiscal marksmanship on CFR. period, saw a significant decrease in capital expenditure
during COVID-19.
CFR = β +β THS_THE +β THS_CHE +β THS_
i
i
1
0
3
i
2
RHE +β PopDensity+β Avg_THE +β THE_2018 + ui Figure 2 shows the pre-COVID-19 and COVID-19
i 4 5 i 6 i average total health expenditure as a share of the state
THS_THE represents Theil’s statistic for total health budget. For India, the pre-COVID-19 period average is
expenditure, THS_CHE is Theil’s statistic for capital health 2.2%, with the COVID-19 period increasing by 0.07%
expenditure, and THS_RHE is Theil’s statistic for revenue points. During the COVID-19 period, most states saw an
health expenditure. PopDensity represents population increase in average health expenditure; however, Arunachal
density, Avg_THE is the average health expenditure during Pradesh, Maharashtra, Nagaland, Rajasthan, and Tripura
the COVID-19 period, and THE_2018 represents total saw a decrease in total average health expenditure as a
health expenditure in a year lag period (2018 – 2019). share of the state budget. During COVID-19, Maharashtra’s
All analyses were conducted using MS Excel and health expenditure fell marginally (Figure 2). Maharashtra
RStudio. The paper adheres to rigorous methodological had the highest number of COVID-19 cases and deaths;
standards to uphold the quality of the inferences; however, thus, the case of a reduced health share in the state budget
some limitations remain. The current study used the is surprising. Gujarat was the only state where the average
government of India data for COVID-19 confirmed and health expenditure remained constant between the two
death cases. Notably, the number of deaths and confirmed periods. Haryana had the highest increase in health
Volume 3 Issue 3 (2025) 137 https://doi.org/10.36922/ghes.2920