
Page 147 - GHES-3-3
P. 147
Global Health Economics and
Sustainability
A comparative analysis
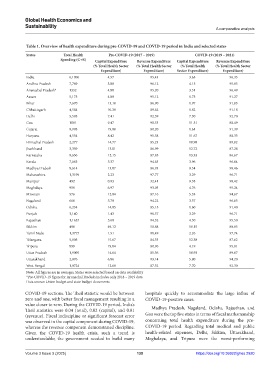
Table 1. Overview of health expenditure during pre‑COVID‑19 and COVID‑19 period in India and selected states
States Total Health Pre‑COVID‑19 (2017 – 2019) COVID‑19 (2019 – 2021)
Spending (C+R) Capital Expenditure Revenue Expenditure Capital Expenditure Revenue Expenditure
(% Total Health Sector (% Total Health Sector (% Total Health (% Total Health Sector
Expenditure) Expenditure) Sector Expenditure) Expenditure)
India 6,1076 4.57 95.43 3.65 96.35
Andhra Pradesh 7,769 3.88 96.12 4.15 95.85
Arunachal Pradesh* 1332 4.80 95.20 3.51 96.49
Assam 5,175 4.88 95.12 8.73 91.27
Bihar 7,670 13.10 86.90 8.97 91.03
Chhattisgarh 4,584 10.38 89.62 8.82 91.18
Delhi 5,595 7.41 92.59 7.30 92.70
Goa 1081 9.47 90.53 11.51 88.49
Gujarat 9,995 19.80 80.20 8.61 91.39
Haryana 4,554 8.42 91.58 11.67 88.33
Himachal Pradesh 2,277 14.77 85.23 10.98 89.02
Jharkhand 3,359 13.01 86.99 12.72 87.28
Karnataka 9,656 12.15 87.85 13.33 86.67
Kerala 7,663 5.37 94.63 3.96 96.04
Madhya Pradesh 8,614 13.07 86.93 9.54 90.46
Maharashtra 1,3199 2.23 97.77 3.29 96.71
Manipur 492 0.93 32.41 9.58 90.42
Meghalaya 959 6.97 93.03 4.76 95.24
Mizoram 576 12.84 87.16 5.33 94.67
Nagaland 660 5.78 94.22 3.37 96.63
Odisha 6,234 14.85 85.15 8.60 91.40
Punjab 3,140 1.43 98.57 3.29 96.71
Rajasthan 1,1657 5.68 94.32 4.50 95.50
Sikkim 490 49.12 50.88 19.15 80.85
Tamil Nadu 1,3777 1.51 98.49 2.26 97.74
Telangana 5,805 15.67 84.33 12.38 87.62
Tripura 899 19.04 80.96 4.19 95.81
Uttar Pradesh 1,9095 14.64 85.36 10.93 89.07
Uttarakhand 2,076 6.86 93.14 5.80 94.20
West Bengal 1,0724 12.68 87.32 7.70 92.30
Note: All figures are in averages. States were selected based on data availability
*Pre-COVID-19 figure for Arunachal Pradesh includes only 2018 – 2019 data
Data source: Union budget and state budget documents
COVID-19 sections. The Theil statistic would be between hospitals quickly to accommodate the large influx of
zero and one, with better fiscal management resulting in a COVID-19-positive cases.
value closer to zero. During the COVID-19 period, India’s
Theil statistics were 0.04 (total), 0.02 (capital), and 0.01 Madhya Pradesh, Nagaland, Odisha, Rajasthan, and
(revenue). Fiscal indiscipline or significant forecast error Goa were the top five states in terms of fiscal marksmanship
was observed in the capital component during COVID-19, concerning total health expenditure during the pre-
whereas the revenue component demonstrated discipline. COVID-19 period. Regarding total medical and public
Given the COVID-19 health crisis, such a trend is health-related expenses, Delhi, Sikkim, Uttarakhand,
understandable; the government needed to build many Meghalaya, and Tripura were the worst-performing
Volume 3 Issue 3 (2025) 139 https://doi.org/10.36922/ghes.2920