
Page 151 - GHES-3-3
P. 151
Global Health Economics and
Sustainability
A comparative analysis
A B
C D
E F
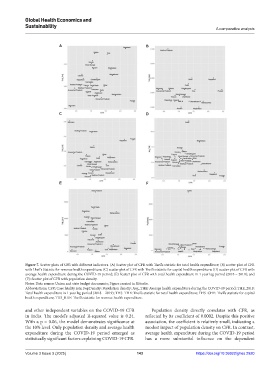
Figure 7. Scatter plots of CFR with different indicators. (A) Scatter plot of CFR with Theil’s statistic for total health expenditure; (B) scatter plot of CFR
with Theil’s Statistic for revenue health expenditure; (C) scatter plot of CFR with Theil’s statistic for capital health expenditure; (D) scatter plot of CFR with
average health expenditure during the COVID-19 period; (E) Scatter plot of CFR with total health expenditure in 1 year lag period (2018 – 2019); and
(F): Scatter plot of CFR with population density.
Notes: Data source: Union and state budget documents; Figure created in RStudio.
Abbreviations: CFR: Case fatality rate; PopDensity: Population density; Avg_THE: Average health expenditure during the COVID-19 period; THE_2018:
Total health expenditure in 1 year lag period (2018 – 2019); THS_THE: Theil’s statistic for total health expenditure; THS_CHE: Theil’s statistic for capital
health expenditure; THS_RHE: Theil’s statistic for revenue health expenditure.
and other independent variables on the COVID-19 CFR Population density directly correlates with CFR, as
in India. The model’s adjusted R-squared value is 0.24. reflected by its coefficient of 0.0002. Despite this positive
With a p = 0.06, the model demonstrates significance at association, the coefficient is relatively small, indicating a
the 10% level. Only population density and average health modest impact of population density on CFR. In contrast,
expenditure during the COVID-19 period emerged as average health expenditure during the COVID-19 period
statistically significant factors explaining COVID-19 CFR. has a more substantial influence on the dependent
Volume 3 Issue 3 (2025) 143 https://doi.org/10.36922/ghes.2920