
Page 150 - GHES-3-3
P. 150
Global Health Economics and
Sustainability
A comparative analysis
curves, followed by states like Sikkim, Tamil Nadu, and Table 3. Correlation of expenditure indicators with Theil’s
Punjab. statistic for total health expenditure
Figures 2 and 3 show that the states had value for total Indicators Correlation
health expenditure. The lagged health expenditure showed coefficient
the highest correlation among all the variables. Total health expenditure in 1 year lag period −0.256
(2018 – 2019)
Table 3 presents the Pearson’s correlation coefficients.
Except for average health expenditure during the Average health expenditure during the 0.008
COVID-19 period
COVID-19 period and total health expenditure in one
1-year lag period, Theil’s capital and revenue expenditure Theil’s statistic for capital health expenditure −0.092
statistics were negatively correlated with the Theil statistics. Theil’s statistic for revenue health expenditure −0.019
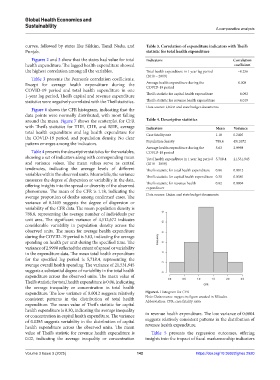
Figure 6 shows the CFR histogram, indicating that the Data source: Union and state budget documents.
data points were normally distributed, with most falling
around the mean. Figure 7 shows the scatterplot for CFR Table 4. Descriptive statistics
with Theil’s statistics for THE, CHE, and RHE, average Indicators Mean Variance
total health expenditure and lag health expenditure for Case fatality rate 1.18 0.2405
the COVID-19 period, and population density. No clear
pattern emerges among the indicators. Population density 788.6 4512672
Average health expenditure during the 5.63 2.9998
Table 4 presents the descriptive statistics for the variables, COVID-19 period
showing a set of indicators along with corresponding mean Total health expenditure in 1 year lag period 5,718.4 21,531,945
and variance values. The mean values serve as central (2018 – 2019)
tendencies, indicating the average levels of different Theil’s statistic for total health expenditure 0.06 0.0012
variables within the observed units. Meanwhile, the variance Theil’s statistic for capital health expenditure 0.30 0.0385
measures the degree of dispersion or variability in the data,
offering insights into the spread or diversity of the observed Theil’s statistic for revenue health 0.02 0.0004
expenditure
phenomena. The mean of the CFR is 1.18, indicating the
average proportion of deaths among confirmed cases. The Data source: Union and state budget documents.
variance of 0.2405 suggests the degree of dispersion or
variability of the CFR data. The mean population density is
788.6, representing the average number of individuals per
unit area. The significant variance of 4,512,672 indicates
considerable variability in population density across the
observed units. The mean for average health expenditure
during the COVID-19 period is 5.63, indicating the average
spending on health per unit during the specified time. The
variance of 2.9998 reflected the extent of spread or variability
in the expenditure data. The mean total health expenditure
for the specified lag period is 5,718.4, representing the
average overall health spending. The variance of 21,531,945
suggests a substantial degree of variability in the total health
expenditure across the observed units. The mean value of
Theil’s statistic for total health expenditure is 0.06, indicating
the average inequality or concentration in total health
expenditure. The low variance of 0.0012 suggests relatively Figure 6. Histogram for CFR
consistent patterns in the distribution of total health Note: Data source: mygov.in; figure created in RStudio.
Abbreviation: CFR: case fatality ratio.
expenditure. The mean value of Theil’s statistic for capital
health expenditure is 0.30, indicating the average inequality
or concentration in capital health expenditure. The variance in revenue health expenditure. The low variance of 0.0004
of 0.0385 suggests variability in the distribution of capital suggests relatively consistent patterns in the distribution of
health expenditure across the observed units. The mean revenue health expenditure.
value of Theil’s statistic for revenue health expenditure is Table 5 presents the regression outcomes, offering
0.02, indicating the average inequality or concentration insights into the impact of fiscal marksmanship indicators
Volume 3 Issue 3 (2025) 142 https://doi.org/10.36922/ghes.2920