
Page 173 - GHES-3-3
P. 173
Global Health Economics and
Sustainability
Path model of child marriage in Africa
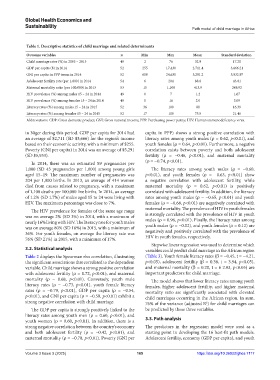
Table 1. Descriptive statistics of child marriage and related determinants
Outcome variables n Min Max Mean Standard deviation
Child marriage rates (%) in 2005 – 2013 49 2 76 32.9 17.20
GDP per capita ($) in 2014 52 255 17,430 2,711.4 3,666.21
GNI per capita in PPP terms in 2014 52 600 24,630 5,291.2 5,932.97
Adolescent fertility rate (per 1,000) in 2014 54 6 204 88.8 43.01
Maternal mortality ratio (per 100,000) in 2013 53 15 1,100 413.9 249.92
HIV prevalence (%) among males 15 – 24 in 2014 49 0 7 1.2 1.67
HIV prevalence (%) among females 15 – 24 in 2014 49 0 16 2.0 3.09
Literacy rates (%) among males 15 – 24 in 2015 52 36 100 80 16.39
Literacy rates (%) among females 15 – 24 in 2015 52 17 100 75.5 21.46
Abbreviations: GDP: Gross domestic product; GNI: Gross national income; PPP: Purchasing power parity; HIV: Human immunodeficiency virus.
in Niger during this period. GDP per capita for 2014 had capita in PPP) shows a strong positive correlation with
an average of $2,711 (SD $3,666) for the region’s income literacy rates among youth males (ρ = 0.62, p<0.01), and
based on their economic activity, with a minimum of $255. youth females (ρ = 0.64, p<0.01). Furthermore, a negative
Poverty (GNI per capita) in 2014 was an average of $5,291 correlation exists between poverty and both adolescent
(SD $5,933). fertility (ρ = −0.46, p<0.01), and maternal mortality
In 2014, there was an estimated 89 pregnancies per (ρ = −0.74, p<0.01).
1,000 (SD 43 pregnancies per 1,000) among young girls The literacy rates among youth males (ρ = −0.60,
aged 15–19. The maximum number of pregnancies was p<0.01), and youth females (ρ = −0.63, p<0.01) show
204 per 1,000 births. In 2013, an average of 414 women a negative correlation with adolescent fertility, while
died from causes related to pregnancy, with a maximum maternal mortality (ρ = 0.62, p<0.01) is positively
of 1,100 deaths per 100,000 live births. In 2014, an average correlated with adolescent fertility. In addition, the literacy
of 1.2% (SD 1.7%) of males aged 15 to 24 were living with rates among youth males (ρ = −0.65, p<0.01) and youth
HIV. The maximum percentage was close to 7%. females (ρ = −0.68, p<0.01) are negatively correlated with
The HIV prevalence for females of the same age range maternal mortality. The prevalence of HIV in youth females
was on average 2% (SD 3%) in 2014, with a maximum of is strongly correlated with the prevalence of HIV in youth
nearly 16% living with HIV. The literacy rate for youth males males (ρ = 0.96, p<0.01). Finally, the literacy rates among
was on average 80% (SD 16%) in 2015, with a minimum of youth males (ρ = −0.02), and youth females (ρ = 0.12) are
36%. For youth females, on average the literacy rate was negatively and positively correlated with the prevalence of
76% (SD 21%) in 2015, with a minimum of 17%. HIV in youth females, respectively.
Stepwise linear regression was used to determine which
3.2. Statistical analysis variables could predict child marriage in the African region
Table 2 displays the Spearman rho correlation, illustrating (Table 3). Youth female literacy rates (β = −0.45, t = −4.21,
the significant associations that correlated to the dependent p<0.05), adolescent fertility (β = 0.38, t = 3.94, p<0.05),
variable. Child marriage shows a strong positive correlation and maternal mortality (β = 0.20, t = 6 2.03, p<0.05) are
with adolescent fertility (ρ = 0.72, p<0.01), and maternal important predictors for child marriage.
mortality (ρ = 0.68, p<0.01). Conversely, youth male The model shows that lower literacy rates among youth
literacy rates (ρ = −0.73, p<0.01), youth female literacy females, higher adolescent fertility, and higher maternal
rates (ρ = −0.79, p<0.01), GDP per capita (ρ = −0.54, mortality ratio are significantly associated with elevated
p<0.01), and GNI per capita (ρ = −0.59, p<0.01) exhibit a child marriages occurring in the African region. In sum,
strong negative correlation with child marriage. 76% of the variance (adjusted R ) for child marriages can
2
The GDP per capita is strongly positively linked to the be predicted by these three variables.
literacy rates among youth men (ρ = 0.60, p<0.01), and
youth women (ρ = 0.60, p<0.01). In addition, there is a 3.3. Path analysis
strong negative correlation between the country’s economy The predictors in the regression model were used as a
and both adolescent fertility (ρ = −0.42, p<0.01), and starting point in developing the 16 best-fit path models.
maternal mortality (ρ = −0.70, p<0.01). Poverty (GNI per Adolescent fertility, economy (GDP per capita), and youth
Volume 3 Issue 3 (2025) 165 https://doi.org/10.36922/ghes.7117