
Page 174 - GHES-3-3
P. 174
Global Health Economics and
Sustainability
Path model of child marriage in Africa
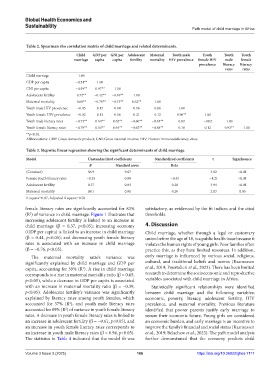
Table 2. Spearman rho correlation matrix of child marriage and related determinants.
Child GDP per GNI per Adolescent Maternal Youth male Youth Youth Youth
marriage capita capita fertility mortality HIV prevalence female HIV male female
prevalence literacy literacy
rates rates
Child marriage 1.00
GDP per capita −0.54** 1.00
GNI per capita −0.59** 0.97** 1.00
Adolescent fertility 0.72** −0.42** −0.46** 1.00
Maternal mortality 0.68** −0.70** −0.74** 0.62** 1.00
Youth male HIV prevalence −0.05 0.15 0.08 0.16 0.06 1.00
Youth female HIV prevalence −0.02 0.13 0.06 0.21 0.12 0.96** 1.00
Youth male literacy rates −0.73** 0.60** 0.62** −0.60** −0.65** 0.02 −0.02 1.00
Youth female literacy rates −0.79** 0.60** 0.64** −0.63** −0.68** 0.18 0.12 0.93** 1.00
**p<0.01.
Abbreviations: GDP: Gross domestic product; GNI: Gross national income; HIV: Human immunodeficiency virus.
Table 3. Stepwise linear regression showing the significant determinants of child marriage
Model Unstandardized coefficients Standardized coefficients t Significance
B Standard error Beta
(Constant) 36.9 9.67 3.82 <0.01
Female youth literacy rates −0.35 0.08 −0.45 −4.21 <0.01
Adolescent fertility 0.17 0.04 0.38 3.94 <0.01
Maternal mortality 0.01 0.01 0.20 2.03 0.05
R square=0.87, Adjusted R square=0.76.
female literacy rates are significantly accounted for 83% satisfactory, as evidenced by the fit indices and the cited
(R ) of variance in child marriage. Figure 1 illustrates that thresholds.
2
increasing adolescent fertility is linked to an increase in
child marriage (β = 0.37, p<0.05); increasing economy 4. Discussion
(GDP per capita) is linked to an increase in child marriage Child marriage, whether through a legal or customary
(β = 0.44, p<0.05); and decreasing youth female literacy union before the age of 18, is a public health issue because it
rates is associated with an increase in child marriage violates the human rights of young girls. Poor families often
(β = −0.76, p<0.05). practice this, as they have limited resources. In addition,
The maternal mortality ratio’s variance was early marriage is influenced by various social, religious,
significantly explained by child marriage and GDP per cultural, and traditional beliefs and norms (Rasmussen
capita, accounting for 59% (R ). A rise in child marriage et al., 2019; Pourtaheri et al., 2023). There has been limited
2
corresponds to a rise in maternal mortality ratio (β = 0.65, research to determine the socioeconomic and reproductive
p<0.05), while a decrease in GDP per capita is associated variables associated with child marriage in Africa.
with an increase in maternal mortality ratio (β = −0.39, Statistically significant relationships were identified
p<0.05). Adolescent fertility’s variance was significantly between child marriage and the following variables:
explained by literacy rates among youth females, which economic, poverty, literacy, adolescent fertility, HIV
accounted for 37% (R ), and youth male literacy rates prevalence, and maternal mortality. Previous literature
2
accounted for 89% (R ) of variance in youth female literacy identified that poorer parents justify early marriage to
2
rates. A decrease in youth female literacy rates is linked to secure their economic future. Young girls are considered
an increase in adolescent fertility (β = −0.61, p<0.05), and an economic burden, and early marriage is an incentive to
an increase in youth female literacy rates corresponds to improve the family’s financial and social status (Rasmussen
an increase in youth male literacy rates (β = 0.94, p<0.05). et al., 2019; Belachew et al., 2023). The path model analysis
The statistics in Table 4 indicated that the model fit was further demonstrated that the economy predicts child
Volume 3 Issue 3 (2025) 166 https://doi.org/10.36922/ghes.7117