
Page 210 - GHES-3-3
P. 210
Global Health Economics and
Sustainability
Neonatal mortality in Pakistan
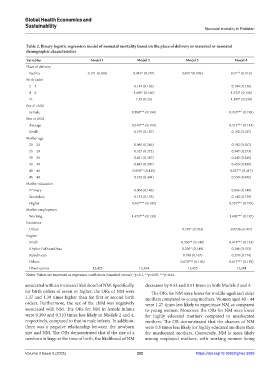
Table 2. Binary logistic regression model of neonatal mortality based on the place of delivery or maternal or neonatal
demographic characteristics
Variables Model 1 Model 2 Model 3 Model 4
Place of delivery
Facility 0.151 (0.100) 0.016* (0.107) 0.091*(0.106) 0.01** (0.110)
Birth order
2 – 3 - 0.114 (0.136) - 0.104 (0.136)
4 – 6 - 1.494* (0.166) - 1.532* (0.166)
7+ - 1.37 (0.23) - 1.391* (0.230)
Sex of child
Female - 0.309*** (0.194) - 0.310*** (0.195)
Size of child
Average - 0.534*** (0.114) - 0.512*** (0.114)
Small - 0.197 (0.187) - 0.160 (0.187)
Mother age
20 – 24 - 0.085 (0.266) - 0.102 (0.267)
25 – 29 - 0.327 (0.272) - 0.347 (0.273)
30 – 34 - 0.421 (0.287) - 0.443 (0.288)
34 – 39 - 0.447 (0.307) - 0.453 (0.308)
40 – 44 - 0.016** (0.415) - 0.027** (0.417)
45 – 49 - 0.552 (0.494) - 0.550 (0.495)
Mother education
Primary - 0.004 (0.146) - 0.066 (0.149)
Secondary - 0.132 (0.135) - 0.140 (0.139)
Higher - 0.567*** (0.192) - 0.527*** (0.197)
Mother employment
Working - 1.473*** (0.133) - 1.402*** (0.137)
Residence
Urban - - 0.195* (0.103) 0.0726 (0.107)
Region
Sindh - - 0.356** (0.149) 0.418*** (0.153)
Khyber Pakhtunkhwa - - 0.256* (0.148) 0.246 (0.153)
Balochistan - - 0.188 (0.167) 0.270 (0.174)
Others - - 0.670*** (0.136) 0.617*** (0.139)
Observations 12,425 12,384 12,425 12,384
Notes: Values are expressed as regression coefficients (standard errors); *p<0.1, **p<0.05, ***p<0.01.
associated with an increased likelihood of NM. Specifically, decreases by 0.53 and 0.51 times in both Models 2 and 4.
for birth orders of seven or higher, the ORs of NM were The ORs for NM were lower for middle-aged and older
1.37 and 1.39 times higher than for first or second birth mothers compared to young mothers. Women aged 40 – 44
orders. Furthermore, the sex of the child was negatively were 1.27 times less likely to experience NM as compared
associated with NM. The ORs for NM in female infants to young women. Moreover, the ORs for NM were lower
were 0.309 and 0.310 times less likely in Models 2 and 4, for highly educated mothers compared to uneducated
respectively, compared to that in male infants. In addition, mothers. The OR demonstrated that the chances of NM
there was a negative relationship between the newborn were 0.5 times less likely for highly educated mothers than
size and NM. The ORs demonstrated that if the size of a for uneducated mothers. Conversely, NM is more likely
newborn is large at the time of birth, the likelihood of NM among employed mothers, with working women being
Volume 3 Issue 3 (2025) 202 https://doi.org/10.36922/ghes.5089