
Page 272 - GHES-3-3
P. 272
Global Health Economics and
Sustainability
Sustainability of Rwanda’s UHC: 2011–2021 and vision 2050
The post-2050 TBPB system should integrate water
and sanitation in accordance with Rwanda’s effective
sovereignty model, primarily utilizing internal resources,
i.e., manpower, money, materials, and methods. The
first three are tangible resources, whereas the fourth, the
methods, is an intangible resource focused on integrating
research and innovation.
3.5. Highlighted benefits, outcomes, and impact
(Specific Objective 5)
3.5.1. Macroeconomic gains
Currently, the amount of macroeconomic gain per capita is
USD 76.7, calculated by subtracting from USD 4.47 from
USD 81.17. When multiplied four times (UMIC level), it
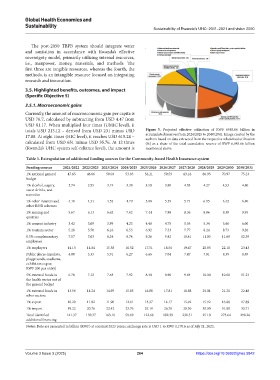
totals USD 213.12 – derived from USD 231 minus USD Figure 5. Projected effective utilization of RWF 6985.66 billion in
17.88. At eight times (HIC level), it reaches USD 615.24 – accumulated reserves from 2024/2025 to 2040/2041. Image created by the
authors based on data extracted from the respective relativized utilization
calculated from USD 651 minus USD 35.76. At 12 times (%) as a share of the total cumulative reserve of RWF 6,985.66 billion
(Rwanda’s UHC system self-reliance level), the amount is mentioned above
Table 3. Extrapolation of additional funding sources for the Community‑based Health Insurance system
Funding sources 2021/2022 2022/2023 2023/2024 2024/2025 2025/2026 2026/2027 2027/2028 2028/2029 2029/2030 2030/2031
1% national general 47.65 46.66 50.03 53.03 56.21 59.59 63.16 66.95 70.97 75.23
budget
1% alcohol, sugary, 2.74 2.95 3.19 3.38 3.58 3.80 4.03 4.27 4.53 4.80
sweet drinks, and
narcotics
1% other insurers and 4.10 4.31 4.52 4.79 5.08 5.39 5.71 6.05 6.42 6.80
other RSSB schemes
1% mining and 5.67 6.13 6.62 7.02 7.44 7.88 8.36 8.86 9.39 9.95
quarries
1% cement industry 3.42 3.69 3.99 4.23 4.48 4.75 5.03 5.34 5.66 6.00
1% tourism sector 5.28 5.70 6.16 6.53 6.92 7.33 7.77 8.24 8.73 9.26
0.5% complementary 7.07 7.63 8.24 8.74 9.26 9.82 10.41 11.03 11.69 12.39
employees
1% employers 14.13 14.84 15.58 16.52 17.51 18.56 19.67 20.85 22.10 23.43
Public places (markets, 4.80 5.33 5.91 6.27 6.65 7.04 7.47 7.91 8.39 8.89
playgrounds, stadiums,
exhibition expos;
RWF 200 per entry)
5% external funds in 6.78 7.12 7.48 7.92 8.40 8.90 9.44 10.00 10.60 11.24
the health sector out of
the general budget
1% external funds in 13.56 14.24 14.95 15.85 16.80 17.81 18.88 20.01 21.21 22.48
other sectors
1% export 10.20 11.02 11.90 12.61 13.37 14.17 15.02 15.92 16.88 17.89
1% import 19.22 20.76 22.42 23.76 25.19 26.70 28.30 30.00 31.80 33.71
Total identified 141.37 150.37 163.16 58.69 122.66 192.39 230.31 251.0 273.64 298.26
additional financing
Notes: Data are presented in billion (RWF) at constant 2023 prices, exchange rate is USD 1 to RWF 1,170.6 as of July 21, 2023.
Volume 3 Issue 3 (2025) 264 https://doi.org/10.36922/ghes.5842