
Page 126 - GPD-4-1
P. 126
Gene & Protein in Disease In silico insights on fisetin’s antidepressant effects
A B
D C
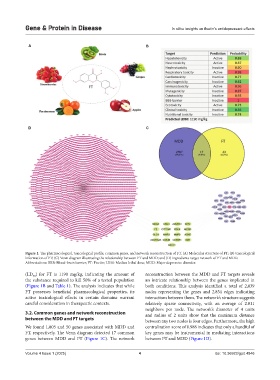
Figure 1. The pharmacological, toxicological profile, common genes, and network reconstruction of FT. (A) Molecular structure of FT; (B) toxicological
information of FT; (C) Venn diagram illustrating the relationship between FT and MDD; and (D) ingredients-target network of FT and MDD.
Abbreviations: BBB: Blood-brain barrier; FT: Fisetin; LD50: Median lethal dose; MDD: Major depressive disorder.
(LD ) for FT is 1190 mg/kg, indicating the amount of reconstruction between the MDD and FT targets reveals
50
the substance required to kill 50% of a tested population an intricate relationship between the genes implicated in
(Figure 1B and Table 1). The analysis indicates that while both conditions. This analysis identified a total of 2,839
FT possesses beneficial pharmacological properties, its nodes representing the genes and 2,854 edges indicating
active toxicological effects in certain domains warrant interactions between them. The network’s structure suggests
careful consideration in therapeutic contexts. relatively sparse connectivity, with an average of 2.011
neighbors per node. The network’s diameter of 4 units
3.2. Common genes and network reconstruction and radius of 2 units show that the maximum distance
between the MDD and FT targets between any two nodes is four edges. Furthermore, the high
We found 1,805 and 50 genes associated with MDD and centralization score of 0.988 indicates that only a handful of
FT, respectively. The Venn diagram detected 17 common key genes may be instrumental in mediating interactions
genes between MDD and FT (Figure 1C). The network between FT and MDD (Figure 1D).
Volume 4 Issue 1 (2025) 4 doi: 10.36922/gpd.4846