
Page 70 - GTM-2-1
P. 70
Global Translational Medicine Mass balance
A B
C D
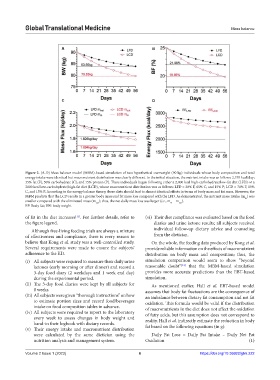
Figure 2. (A-D) Mass balance model (MBM)-based simulation of two hypothetical overweight (90 kg) individuals whose body composition and total
energy intake were identical but macronutrient distribution was clearly different. In the initial situation, the nutrient intake was as follows: 2,750 kcal/day;
35% fat (F), 50% carbohydrate (C), and 15% protein (P). These individuals began following either a 2,000 kcal high-carbohydrate/low-fat diet (LFD) or a
2000 kcal low-carbohydrate/high-fat diet (LCD), whose macronutrient distribution was as follows: LFD = 20% F, 65% C, and 15% P; LCD = 70% F, 15%
C, and 15% P. According to the energy balance theory, these diets should lead to almost identical effects in terms of body mass and fat mass. However, the
MBM predicts that the LCD results in a greater body mass and fat mass loss compared with the LFD. As demonstrated, the nutrient mass intake (m ) was
in
smaller compared with the eliminated mass (m ); thus, the net daily mass loss was larger (i.e., m – m ).
out
out
in
BF: Body fat; BW: body weight.
of fat in the diet increases . For further details, refer to (vi) Their diet compliance was evaluated based on the food
[11]
the figure legend. diaries and urine ketone results; all subjects received
Although free-living feeding trials are always a mixture individual follow-up dietary advice and counseling
of effectiveness and compliance, there is every reason to from the dietician.
believe that Kong et al. study was a well-controlled study. On the whole, the feeding data produced by Kong et al.
Several requirements were made to ensure the subjects’ provide reliable information on the effects of macronutrient
adherence to the KD. distribution on body mass and composition; thus, the
(i) All subjects were required to measure their daily urine simulation comparison would seem to show “beyond
[13]
ketones (early morning or after dinner) and record a reasonable doubt” that the MBM-based simulation
3-day food diary (2 weekdays and 1 week end day) provides more accurate predictions than the EBT-based
during the experimental period. simulation.
(ii) The 3-day food diaries were kept by all subjects for As mentioned earlier, Hall et al. EBT-based model
8 weeks. assumes that body fat fluctuations are the consequence of
(iii) All subjects were given “thorough instructions” on how an imbalance between dietary fat consumption and net fat
to estimate portion sizes and record food/beverages oxidation. This formula would be valid if the distribution
intake on food composition tables in advance. of macronutrients in the diet does not affect the oxidation
(iv) All subjects were required to report to the laboratory of fatty acids, but this assumption does not correspond to
every week to assess changes in body weight and reality. Hall et al. indirectly estimate the reduction in body
hand-in their logbook with dietary records.
(v) Their energy intake and macronutrient distribution fat based on the following equations (in g):
were calculated by the same dietician using the Daily Fat Loss = Daily Fat Intake – Daily Net Fat
nutrition analysis and management system. Oxidation (1)
Volume 2 Issue 1 (2023) 6 https://doi.org/10.36922/gtm.222