
Page 69 - GTM-2-1
P. 69
Global Translational Medicine Mass balance
the MBM with the EBT-based model of Hall et al. have a “normal diet” (ND; carbohydrate 44.0 ± 7.6%, protein
[9]
demonstrated that the MBM seems to be superior to the 15.4 ± 3.3%, and fat 39.6 ± 5.8%) for 4 weeks as a baseline
[7]
EBT-based model . The difference in prediction accuracy and then switched to a very-low-carbohydrate/high-fat
is especially clear when the distribution of macronutrient diet (KD; carbohydrate 9.2 ± 4.8%, protein 21.9 ± 3.4%,
intake changes drastically, for example, a low-carbohydrate and fat 69.0 ± 5.4%) for another 4 weeks. The study showed
diet versus an isocaloric high-carbohydrate diet. The that the 4-week KD intervention led to marked reductions
ranking of such models is determined by their predictive in body mass (−2.9 kg) and body fat percentage (−2.0%).
accuracy, which is also the reason for such models to be The results of the MBM-based simulations closely resemble
developed. Emphasizing that the MBM predicts not only those of the feeding trial, whereas the predictions of the
the change in total body mass, but also the change in fat EBT-based simulations are clearly incorrect. It is necessary
mass is essential. to pay close attention to how the incorrect formula (Daily
Fat Loss) = (Daily Fat Intake) – (Daily Net Fat Oxidation)
Figure 1, which is adapted from Arencibia-Albite’s and affects the prediction results of the EBT-based model. The
Manninen’s study , presents a comparative simulation aforementioned formula would be valid only if the net
[7]
between the EBT-based model and the MBM . All data fat oxidation is independent of the diet´s macronutrient
[3]
[9]
can be found in the original source ; therefore, there is distribution. If the net fat oxidation increases as dietary fat
[7]
no reason to repeat them here. However, it is difficult to intake increases (and vice versa), fat loss may be similar
understand what these simulation results mean. Hence, the among isocaloric diets that vary greatly in fat content. Hall
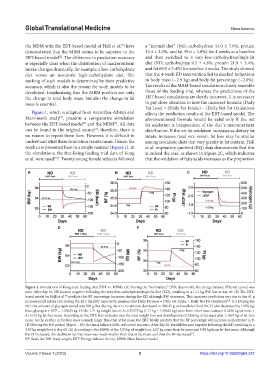
results are presented here in a simple manner (Figure 1). In et al. respiratory quotient (RQ) data demonstrate that this
the simulations, the free-living feeding trial data of Kong is indeed the case, as shown in Figure 2C, which indicates
et al. were used . Twenty young female subjects followed that the oxidation of fatty acids increases as the proportion
[10]
A B C
D E
Figure 1. Simulations of Kong et al. feeding trial (EBT vs. MBM). (A) During the “normal diet” (ND; days 0–30), the energy balance (EB; red curve) was
zero. After day 30, EB became negative following the very-low-carbohydrate/high-fat diet (KD), resulting in a 1.71 kg BW loss at day 60. (B) The EBT-
based model by Hall et al. predicts that BF percentage increases during the KD although BW decreases. This incorrect prediction was due to the 41 g
[9]
increase in fat intake (FI) during the KD; the EBT incorrectly assumes that Daily Fat Loss = Daily Fat Intake – Daily Net Fat Oxidation . (C) During the
[12]
ND, the amount of glycogen stored was 500 g, but during the KD, its amount decreased to 280.25 g; extracellular fluid (ECF) also decreased by 1.076 kg;
thus, glycogen + ECF = 1.35625 kg. Of the 1.71 kg weight loss in A, 0.35375 kg (1.71 kg – 1.35625 kg) were from other mass sources: 0.2436 kg fat mass +
0.11015 kg fat-free mass. According to the EBT, this indicates that the total weight loss was distributed as 0.2436 kg of fat mass plus 1.4664 kg of fat-free
mass. As the decline in fat-free mass is much larger than that of fat mass, the EBT falsely predicts that the BF percentage will increase as illustrated in B.
(D) During the ND period (days 0 – 30), the mass balance (MB; red curve) was zero. After day 30, the MB became negative following the KD, resulting in a
3.05 kg weight loss at day 60. (E) According to the MBM, of the 3.05 kg of weight loss, 2.07 kg came from fat mass and 0.98 kg from fat-free mass. Although
the FI increased, the decline in fat-free mass was much smaller than that of fat mass, and thus the BF decreased .
[7]
BF: Body fat; BW: body weight; EBT: Energy balance theory; MBM: Mass balance model.
Volume 2 Issue 1 (2023) 5 https://doi.org/10.36922/gtm.222