Page 89 - GTM-2-3
P. 89

Global Translational Medicine                                           HPLC-UV lacosamide quantification


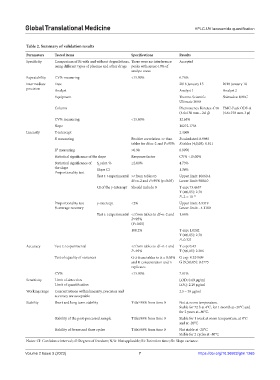
            Table 2. Summary of validation results
            Parameters  Tested items                     Specifications      Results
            Specificity  Comparison of Rt with and without degradations,  There were no interference   Accepted
                        using different types of plasmas and other drugs  peaks with areas>10% of
                                                         analyte areas
            Repeatability  CV% measuring                 <15.00%             6.76%
            Intermediate   Date                                              2018 January 15    2018 January 18
            precision   Analyst                                              Analyst 1          Analyst 2
                        Equipment                                            Thermo Scientific   Shimadzu UFLC
                                                                             Ultimate 3000
                        Column                                               Phenomenex Kinetex-C18  YMC-Pack ODS-A
                                                                             (4.6×150 mm – 2.6 μ)  (4.6×150 mm-3 μ)
                        CV% measuring                    <15.00%             12.64%
                        Slope                                                10272.1754
            Linearity   Y-intercept                                          2.4069
                        R measuring                      Positive correlation >r than   R calculated: 0.9985
                                                         tables for df=n-2 and P=95%  R tables (4;0,05): 0.811
                        R  measuring                     >0.98               0.9970
                         2
                        Statistical significance of the slope  Response factor  CV% <15.00%
                        Statistical significance of   S relat. %  ≤2.00%     4.73%
                                           b
                        the slope         Slope CI                           1.36%
                        Proportionality test
                                          Test t: t experimental >r from tables to   Upper limit: 10660.4
                                                         df=n-2 and P=95% (p<0.05)  Lower limit: 9884.0
                                          CI of the y-intercept  Should include 0  T exp: 73.4657
                                                                             T (4;0,05): 2.78
                                                                             P=2 × 10 -16
                        Proportionality test  y-intercept  <2%               Upper limit: 8.9319
                        % average recovery                                   Lower limit: - 4.1180
                                          Test t: t experimental <t from tables to df=n-2 and   1.66%
                                                         P=95%
                                                         (P>0.05)
                                                         100.2%              T exp: 1.0242
                                                                             T (4;0,05): 2.78
                                                                             P=0.321
            Accuracy    Test t: t experimental           <t from tables to df=n-1 and   T exp: 0.43
                                                         P=95%               T (8;0,05): 2.306
                        Test of equality of variances    G<t from tables to α = 0.05%  G exp: 0.324609
                                                         and K concentration and n   G (9;3;0,05): 0.4775
                                                         replicates
                        CV%                              <15.00%             7.01%
            Sensitivity  Limit of detection                                  LOD: 0.69 µg/ml
                        Limit of quantification                              LOQ: 2.29 µg/ml
            Working range  Concentrations within linearity, precision and    2.5 – 30 µg/ml
                        accuracy are acceptable
            Stability   Short and long-term stability    Title≥90% from time 0   Not at room temperature.
                                                                             Stable for 72 h at 4°C, for 1 month at−20°C and
                                                                             for 2 years at−80°C.
                        Stability of the post-processed sample  Title≥90% from time 0   Stable for 1 week at room temperature, at 4°C
                                                                             and at -20°C
                        Stability of freeze and thaw cycles  Title≥90% from time 0   Not stable at -20°C
                                                                             Stable for 2 cycles at -80°C
            Notes: CI: Confidence interval; df: Degrees of freedom; N/A: Not applicable; Rt: Retention time; Sb: Slope variance.

            Volume 2 Issue 3 (2023)                         7                        https://doi.org/10.36922/gtm.1265
   84   85   86   87   88   89   90   91   92   93   94