
Page 98 - GTM-2-3
P. 98
Global Translational Medicine Autoimmune diseases after vaccination
Table 1. Autoimmune adverse events and doses by COVID‑19 vaccine. VAERS data include adverse event reports from 1990 to
May 19, 2023
Adverse event COVID‑19 Ad26.Cov2.S COVID‑19 elasomeran COVID‑19 tozinameran
Administered doses 19,007,537 (3.1%) 232,147,784 (37.6%) 366,979,906 (59.4%)
Alopecia 220 (5.5%) 1,174 (29.6%) 2,570 (64.8%)
Arthritis 204 (4.9%) 1,277 (30.6%) 2,692 (64.5%)
Bell’s palsy 343 (4.7%) 1,981 (27.1%) 4,980 (68.2%)
Guillain-Barré syndrome 554 (16.2%) 657 (19.3%) 2,200 (64.5%)
Immune thrombocytopenia 108 (6.6%) 383 (23.3%) 1,155 (70.2%)
Rheumatoid arthritis 109 (3.2%) 824 (24.4%) 2,443 (72.4%)
Note: The percentages in parentheses represent the proportion of this adverse event by vaccine.
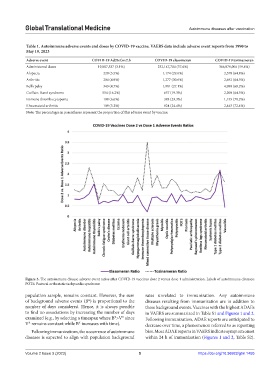
Figure 3. The autoimmune disease adverse event ratios after COVID-19 vaccines dose 2 versus dose 1 administration. Labels of autoimmune diseases:
POTS: Postural orthostatic tachycardia syndrome.
population sample, remains constant. However, the sum rates unrelated to immunization. Any autoimmune
of background adverse events (B ) is proportional to the diseases resulting from immunization are in addition to
X
number of days considered. Hence, it is always possible these background events. Vaccines with the highest ADAEs
to find no associations by increasing the number of days in VAERS are summarized in Table S1 and Figures 1 and 2.
examined (e.g., by selecting a timespan where B >V since Following immunization, ADAE reports are anticipated to
X
X
V remains constant while B increases with time). decrease over time, a phenomenon referred to as reporting
X
X
Following immunizations, the occurrence of autoimmune bias. Most ADAE reports in VAERS indicate symptom onset
diseases is expected to align with population background within 24 h of immunization (Figures 1 and 2, Table S2).
Volume 2 Issue 3 (2023) 5 https://doi.org/10.36922/gtm.1455