
Page 61 - GTM-4-2
P. 61
Global Translational Medicine Sleep and emotion rhythmicity in tweets
A B C
E F
D
G
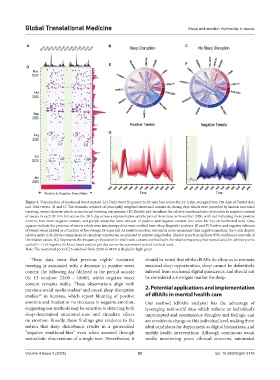
Figure 1. Visualization of emotional tweet content. (A) Daily tweet frequency in 20-min bins across the 24-h day, averaged from 258 days of Twitter data
and 1868 tweets. (B and C) The semantic network of principally weighted emotional constructs during days which were preceded by known nocturnal
tweeting, versus those in which no nocturnal tweeting was present. (D) Double plot visualizes the relative emotional ratio of positive to negative content
of tweets in each 20-min bin across the 24-h day across a representative sample period from June to November 2020, with red indicating more positive
content, blue more negative content, and purple about the same amount of positive and negative content (see color bar key on horizontal axis). Gray
squares indicate the presence of tweets which were timestamped but were omitted from sleep-linguistic analyses. (E and F) Positive and negative valences
of tweets when plotted as a function of the average 24-h period. As positive emotion was much more prominent than negative emotion, the y-axis depicts
relative units to facilitate comparisons of circadian trajectories, as opposed to relative magnitudes. Shaded error bars indicate 95% confidence intervals of
the relative values. (G) Represents the frequency of positive (in red) tweet content overlaid with the relative frequency (horizontal axis) (in arbitrary units
scaled 0 – 1) of negative (in blue) tweet content per day across the assessment period (vertical axis).
Note: The nocturnal period (L5 window) from 23:00 to 04:00 is shaded in light green.
These data show that previous nights’ nocturnal should be noted that whilst dRARs do allow us to estimate
tweeting is associated with a decrease in positive tweet maximal sleep opportunities, sleep cannot be definitively
content the following day (defined as the period outside inferred from nocturnal digital quiescence, and should not
the L5 window: 23:00 – 04:00), whilst negative tweet be considered a surrogate marker for sleep.
content remains stable. These observations align with
1
previous social media studies and causal sleep-disruption 2. Potential applications and implementation
3,5
studies in humans, which report blunting of positive of dRARs in mental health care
emotion and modest or no increases in negative emotion, Our method (dRARs analysis) has the advantage of
suggesting our methods may be sensitive to detecting both leveraging real-world data which reflects an individual’s
sleep-determined emotional-state and circadian effects unprompted and spontaneous thoughts and feelings, and
on emotion. Broadly, these findings give credence to the are sensitive to change on this individual level, making them
notion that sleep disturbance results in a generalized ideal candidates for deployment as digital biomarkers, and
“negative emotional-bias” even when assessed through mobile health interventions. Although continuous social
naturalistic observations of a single user. Nevertheless, it media monitoring poses ethnical concerns, automated
Volume 4 Issue 2 (2025) 53 doi: 10.36922/gtm.5176