
Page 108 - GTM-4-3
P. 108
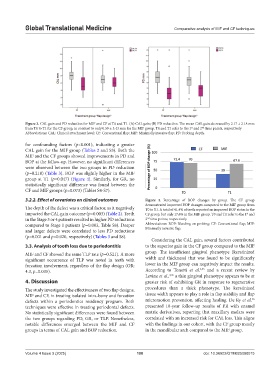
Global Translational Medicine                                  Comparative analysis of MIF and CF techniques


            Figure 3. CAL gain and PD reduction for MIF and CF at T0 and T1. (A) CAL gain; (B) PD reduction. The mean CAL gain decreased by 2.17 ± 2.18 mm
            from T0 to T1 for the CF group, in contrast to only 0.59 ± 3.43 mm for the MIF group. T0 and T1 refer to the 1  and 2  time points, respectively
                                                                                       nd
                                                                                  st
            Abbreviations: CAL: Clinical attachment level; CF: Conventional flap; MIF: Minimally invasive flap; PD: Probing depth.
            for confounding factors (p<0.001), indicating a greater
            CAL gain for the MIF group (Tables 2 and S3). Both the
            MIF and the CF groups showed improvements in PD and
            BOP at the follow-up. However, no significant differences
            were observed between the two groups in PD reduction
            (p=0.218) (Table 3). BOP was slightly higher in the MIF
            group at T1 (p=0.047) (Figure  4). Similarly, for GR, no
            statistically significant difference was found between the
            CF and MIF groups (p=0.073) (Tables S4-S7).
            3.2.2. Effect of covariates on clinical outcomes   Figure  4. Percentage of BOP changes by group. The CF group
                                                               demonstrated improved BOP changes compared to the MIF group from
            The depth of the defect was a critical factor, as it negatively   T0 to T1. A total of 41.4% of teeth reported an improved BOP status in the
            impacted the CAL gain outcome (p=0.003) (Table 2). Teeth   CF group, but only 17.6% in the MIF group. T0 and T1 refer to the 1  and
                                                                                                          st
            in the Stage 3 or 4 patients resulted in higher PD reductions   2  time points, respectively.
                                                                nd
            compared to Stage 1 patients (p=0.003, Table S8). Deeper   Abbreviations: BOP: Bleeding on probing; CF: Conventional flap; MIF:
            and larger defects were correlated to less PD reductions   Minimally invasive flap.
            (p=0.001 and p=0.020, respectively) (Tables 3 and S8).
                                                                 Considering the CAL gain, several factors contributed
            3.3. Analysis of tooth loss due to periodontitis   to the superior gain in the CF group compared to the MIF

            MIF and CF showed the same TLP rate (p=0.521). A more   group. The insufficient gingival phenotype (keratinized
            significant occurrence of TLP was noted in teeth with   width and thickness) that was found to be significantly
            furcation involvement, regardless of the flap design (OR:   lower in the MIF group can negatively impact the results.
                                                                                      3,35
            4.3, p=0.035).                                     According to Tonetti  et al.  and a recent review by
                                                               Levine et al.,  a thin gingival phenotype appears to be at
                                                                         3,35
            4. Discussion                                      greater risk of exhibiting GR in response to regenerative
            The study investigated the effectiveness of two flap designs,   procedures than a thick phenotype. The keratinized
            MIF and CF, in treating isolated intra-bony and furcation   tissue width appears to play a role in flap stability and flap
                                                                                                            36
            defects within a periodontics residency program. Both   micromotion prevention, affecting healing. De Ry et al.
            techniques were effective in treating periodontal defects.   presented 10-year follow-up results of PR with enamel
            No statistically significant differences were found between   matrix derivatives, reporting that maxillary molars were
            the two groups regarding PD, GR, or TLP. Nonetheless,   correlated with an increased risk for CAL loss. This aligns
            notable differences emerged between the MIF and CF   with the findings in our cohort, with the CF group mostly
            groups in terms of CAL gain and BOP reduction.     in the mandibular arch compared to the MIF group.


            Volume 4 Issue 3 (2025)                        100                          doi: 10.36922/GTM025080015