
Page 31 - IJAMD-2-1
P. 31
International Journal of AI for
Materials and Design
ML molecular modeling of Ru: A KAN approach
2.3. Training data processing eigenvalues. The data were then projected onto the PCs to
To effectively process crystal structures for ML applications, obtain a reduced data matrix :
35
the Python Materials Genomics (pymatgen) Library X=X V (Ⅵ)
was utilized in conjunction with the Smooth Overlap centered reduced
of Atomic Positions (SOAP) descriptor, implemented where V reduced includes eigenvectors corresponding to
through the DScribe Python package, to convert the largest eigenvalues that capture 95% of the variance.
40
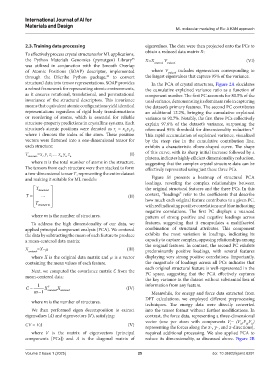
structural data into tensor representations. SOAP provides In the PCA of crystal structures, Figure 2A elucidates
a robust framework for representing atomic environments, the cumulative explained variance ratio as a function of
as it ensures rotational, translational, and permutational component number. The first PC accounts for 80.5% of the
invariance of the structural descriptors. This invariance total variance, demonstrating its dominant role in capturing
means that equivalent atomic configurations yield identical the dataset’s primary features. The second PC contributes
representations regardless of rigid body transformations an additional 12.2%, bringing the cumulative explained
or reordering of atoms, which is essential for reliable variance to 92.7%. Notably, the first three PCs collectively
structure-property predictions in crystalline systems. Each explain 97.6% of the dataset’s variance, surpassing the
structure’s atomic positions were denoted as r = x ,y ,z , often-used 95% threshold for dimensionality reduction.
41
i
i
i
i
where denotes the index of the atom. These position This rapid accumulation of explained variance, visualized
vectors were flattened into a one-dimensional tensor for by the steep rise in the cumulative contribution line,
each structure: exhibits a characteristic elbow-shaped curve. The shape
T structure =x y z … x y z n (Ⅰ) of this curve, with its sharp initial increase followed by a
1
n
n
1
1
plateau, indicates highly efficient dimensionality reduction,
where is the total number of atoms in the structure. suggesting that the complex crystal structure data can be
The tensors from each structure were then stacked to form effectively represented using just these three PCs.
a two-dimensional tensor , representing the entire dataset
and making it suitable for ML models: Figure S1 presents a heatmap of structural PCA
loadings, revealing the complex relationships between
T structure1 the original structural features and the three PCs. In this
T = ... (Ⅱ) context, “loadings” refer to the coefficients that describe
T how much each original feature contributes to a given PC,
structure m with red indicating positive correlations and blue indicating
negative correlations. The first PC displays a nuanced
where is the number of structures. pattern of strong positive and negative loadings across
To address the high dimensionality of our data, we features, suggesting that it encapsulates a multifaceted
applied principal component analysis (PCA). We centered combination of structural attributes. This component
the data by subtracting the mean of each feature to produce exhibits the most variation in loadings, indicating its
a mean-centered data matrix: capacity to capture complex, opposing relationships among
the original features. In contrast, the second PC exhibits
X centered =X−μ (Ⅲ) predominantly positive loadings, with several features
where X is the original data matrix and µ is a vector displaying very strong positive correlations. Importantly,
containing the mean values of each feature. the magnitude of loadings across all PCs indicates that
each original structural feature is well-represented in the
Next, we computed the covariance matrix from the
mean-centered data: PC space, suggesting that the PCA effectively captures
the key variance in the dataset without substantial loss of
1 information from any feature.
C X T centered X centered (Ⅳ)
m 1 Meanwhile, for energy and force data extracted from
DFT calculations, we employed different preprocessing
where is the number of structures.
techniques. The energy data were directly converted
We then performed eigen decomposition to extract into the tensor format without further modifications. In
eigenvalues () and eigenvectors (), satisfying: contrast, the force data, representing a three-dimensional
vector (one per atom with components F= (F ,F ,F )
CV = VΛ (Ⅴ) i ix iy iz
representing the forces along the -, -, and -directions),
where is the matrix of eigenvectors (principal required additional processing. We also applied PCA to
components [PCs]) and is the diagonal matrix of reduce its dimensionality, as discussed above. Figure 2B
Volume 2 Issue 1 (2025) 25 doi: 10.36922/ijamd.8291