
Page 32 - IJAMD-2-1
P. 32
International Journal of AI for
Materials and Design
ML molecular modeling of Ru: A KAN approach
A B
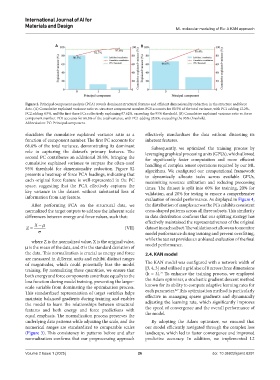
Figure 2. Principal component analysis (PCA) reveals dominant structural features and efficient dimensionality reduction in the structure and force
data. (A) Cumulative explained variance ratio vs. structure component number. PC0 accounts for 80.5% of the total variance, with PC1 adding 12.2%,
PC2 adding 4.9%, and the first three PCs collectively explaining 97.62%, exceeding the 95% threshold. (B) Cumulative explained variance ratio vs. force
component number. PC0 accounts for 66.6% of the total variance, with PC1 adding 28.8%, exceeding the 95% threshold.
Abbreviation: PC: Principal component.
elucidates the cumulative explained variance ratio as a effectively standardizes the data without distorting its
function of component number. The first PC accounts for inherent features.
66.6% of the total variance, demonstrating its dominant Subsequently, we optimized the training process by
role in capturing the dataset’s primary features. The leveraging graphical processing units (GPUs), which allowed
second PC contributes an additional 28.8%, bringing the for significantly faster computation and more efficient
cumulative explained variance to surpass the often-used handling of complex tensor operations required by our ML
95% threshold for dimensionality reduction. Figure S2 algorithms. We configured our computational framework
presents a heatmap of force PCA loadings, indicating that to dynamically allocate tasks across available GPUs,
each original force feature is well-represented in the PC maximizing resource utilization and reducing processing
space, suggesting that the PCA effectively captures the times. The dataset is split into 60% for training, 20% for
key variance in the dataset without substantial loss of validation, and 20% for testing to ensure a comprehensive
information from any feature. evaluation of model performance. As displayed in Figure 4,
After performing PCA on the structural data, we the distribution of samples across the PCs exhibits consistent
normalized the target outputs to address the inherent scale cross-shaped patterns across all three subsets. This similarity
differences between energy and force values, such that: in data distribution confirms that our splitting strategy has
effectively maintained the representativeness of the original
X
Z (Ⅶ) dataset in each subset. The validation set allows us to monitor
model performance during training and prevent overfitting,
while the test set provides an unbiased evaluation of the final
where Z is the normalized value, X is the original value,
μ is the mean of the data, and σ is the standard deviation of model performance.
the data. This normalization is crucial as energy and force 2.4. KAN model
are measured in different units and exhibit distinct ranges
of magnitudes, which could potentially bias the model The KAN model was configured with a network width of
training. By normalizing these quantities, we ensure that [3, 4, 3] and utilized a grid size of 8 across three dimensions
27
both energy and force components contribute equally to the (k = 3). To enhance the training process, we employed
loss function during model training, preventing the larger- the Adam optimizer, a stochastic gradient descent method
scale variable from dominating the optimization process. known for its ability to compute adaptive learning rates for
42
This standardized representation of target variables helps each parameter. This optimization method is particularly
maintain balanced gradients during training and enables effective in managing sparse gradients and dynamically
the model to learn the relationships between structural adjusting the learning rate, which significantly improves
features and both energy and force predictions with the speed of convergence and the overall performance of
equal emphasis. The normalization process preserves the the model.
underlying data patterns while adjusting the scale, and the By adopting the Adam optimizer, we ensured that
numerical ranges are standardized to comparable scales our model efficiently navigated through the complex loss
(Figure 3). This consistency in patterns before and after landscape, which led to faster convergence and improved
normalization confirms that our preprocessing approach predictive accuracy. In addition, we implemented L2
Volume 2 Issue 1 (2025) 26 doi: 10.36922/ijamd.8291