
Page 37 - IJAMD-2-1
P. 37
International Journal of AI for
Materials and Design
ML molecular modeling of Ru: A KAN approach
A B
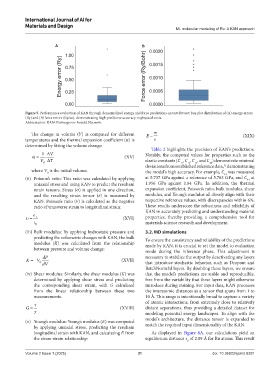
Figure 5. Performance evaluation of KAN through denormalized energy and force predictions on test dataset: box plot distribution of (A) energy errors
(Ry) and (B) force errors (Ry/au), demonstrating high predictive accuracy in physical units.
Abbreviation: KAN: Kolmogorov-Arnold Network.
The change in volume () is computed for different E (ⅩⅨ)
temperatures and the thermal expansion coefficient () is
determined by fitting the volume change:
Table 2 highlights the precision of KAN’s predictions.
1 V Notably, the computed values for properties such as the
(ⅩⅤ)
V O T elastic constants ( , , , and ) demonstrate minimal
13
44
11
12
51
deviations from established reference data, demonstrating
where V is the initial volume. the model’s high accuracy. For example, was measured
0
11
(ii) Poisson’s ratio: This ratio was calculated by applying at 5.737 GPa against a reference of 5.763 GPa, and at
44
uniaxial stress and using KAN to predict the resultant 1.956 GPa against 1.84 GPa. In addition, the thermal
strain tensors. Stress () is applied in one direction, expansion coefficient, Poisson’s ratio, bulk modulus, shear
and the resulting strain tensor () is measured by modulus, and Young’s modulus all closely align with their
KAN. Poisson’s ratio () is calculated as the negative respective reference values, with discrepancies within 6%.
ratio of transverse strain to longitudinal strain: These results underscore the robustness and reliability of
KAN in accurately predicting and understanding material
(ⅩⅥ) properties, thereby providing a comprehensive tool for
materials science research and development.
(iii) Bulk modulus: By applying hydrostatic pressure and 3.2. MD simulations
predicting the volumetric changes with KAN, the bulk To ensure the consistency and reliability of the predictions
modulus () was calculated from the relationship made by KAN, it is crucial to set the model to evaluation
between pressure and volume change:
mode during the inference phase. This adjustment is
dP necessary to stabilize the output by deactivating any layers
K V 0 dV (ⅩⅦ) that introduce stochastic behavior, such as Dropout and
BatchNorm2d layers. By disabling these layers, we ensure
(iv) Shear modulus: Similarly, the shear modulus () was that the model’s predictions are stable and reproducible,
determined by applying shear stress and predicting free from the variability that these layers might otherwise
the corresponding shear strain, with calculated introduce during training. For input data, KAN processes
from the linear relationship between these two the interatomic distances as a tensor that spans from 1 to
measurements. 10 Å. This range is intentionally broad to capture a variety
of atomic interactions, from extremely close to relatively
G (ⅩⅧ) distant separations, thus providing a detailed dataset for
modeling potential energy landscapes. To align with the
model’s architecture, the distance tensor is expanded to
(v) Young’s modulus: Young’s modulus () was computed match the required input dimensionality of the KAN.
by applying uniaxial stress, predicting the resultant
longitudinal strain with KAN, and calculating from As displayed in Figure 6A, our calculations yield an
the stress-strain relationship: equilibrium distance r of 2.89 Å for Ru atoms. This result
0
Volume 2 Issue 1 (2025) 31 doi: 10.36922/ijamd.8291