
Page 39 - IJAMD-2-1
P. 39
International Journal of AI for
Materials and Design
ML molecular modeling of Ru: A KAN approach
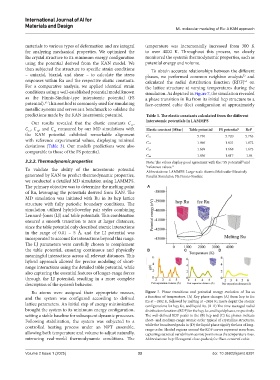
materials to various types of deformation and are integral temperature was incrementally increased from 300 K
for analyzing mechanical properties. We optimized the to over 4000 K. Throughout this process, we closely
Ru crystal structure to its minimum energy configuration monitored the system’s thermodynamic properties, such as
using the potential derived from the KAN model. We potential energy and volume.
then subjected the structure to specific strain conditions To obtain accurate relationships between the different
– uniaxial, biaxial, and shear – to calculate the stress phases, we performed common neighbor analysis and
53
responses within Ru and the respective elastic constants. calculated the radial distribution function (RDF) on
54
For a comparative analysis, we applied identical strain the lattice structure at varying temperatures during the
conditions using a well-established potential model known simulation. As depicted in Figure 7, the simulation revealed
as the Finnis-Sinclair-type interatomic potential (FS a phase transition in Ru from its initial hcp structure to a
potential). This method is commonly used for simulating face-centered cubic (fcc) configuration at approximately
52
metallic systems and serves as a benchmark to validate the
predictions made by the KAN interatomic potential. Table 3. The elastic constants calculated from the different
Our results revealed that the elastic constants , interatomic potentials in LAMMPS
11
, , and measured by our MD simulations with Elastic constant (Mbar) Table potential FS potential a Ref b
13
44
12
the KAN potential exhibited remarkable alignment C11 5.740 5.720 5.763
with reference experimental values, displaying minimal 1.866 1.831 1.872
deviations (Table 3). Our model’s predictions were also C12 1.669 1.668 1.673
comparable to those of the FS potential. C13
C44 1.856 1.817 1.84
3.2.2. Thermodynamic properties Note: The values display good agreement with the: FS potential and
52
a
b reference values. 51
To validate the ability of the interatomic potential Abbreviations: LAMMPS: Large-scale Atomic/Molecular Massively
generated by KAN to predict thermodynamic properties, Parallel Simulator; FS: Finnis-Sinclair.
we conducted a detailed MD simulation using LAMMPS.
The primary objective was to determine the melting point A
of Ru, leveraging the potentials derived from KAN. The
MD simulation was initiated with Ru in its hcp lattice
structure with fully periodic boundary conditions. The
simulation utilized hybrid/overlay pair styles combining
Lennard-Jones (LJ) and table potentials. This combination
ensured a smooth transition to zero at larger distances,
since the table potential only described atomic interactions
in the range of 0.01 – 5 Å, and the LJ potential was
incorporated to account for interactions beyond this range.
The LJ parameters were carefully chosen to complement
the table potential, ensuring continuous and physically B C D
meaningful interactions across all relevant distances. This
hybrid approach allowed for precise modeling of short-
range interactions using the detailed table potential, while
also capturing the essential features of longer-range forces
through the LJ potential, resulting in a more complete
description of the system’s behavior.
Ru atoms were assigned their appropriate masses, Figure 7. Phase transitions and potential energy evolution of Ru as
and the system was configured according to defined a function of temperature. (A) Key phase changes (A) from hcp to fcc
lattice parameters. An initial step of energy minimization Ru at ~1882 K, followed by melting at ~2416 K; insets depict the atomic
configurations for hcp, fcc, and liquid Ru. (B-D) The time-averaged radial
brought the system to its minimum energy configuration, distribution functions (RDF) for the hcp, fcc, and liquid phases, respectively.
setting a stable baseline for subsequent dynamic processes. The well-defined RDF peaks in the (B) hcp and (C) fcc phases indicate
Following stabilization, the system was subjected to a short- and medium-range atomic order typical of crystalline structures,
controlled heating process under an NPT ensemble, while the broadened peaks in (D) the liquid phase signify the loss of long-
range order. Shaded regions around the RDF curves represent error bars,
allowing both temperature and volume to adjust naturally, capturing statistical variability in atomic positions as the temperature rises.
mirroring real-world thermodynamic conditions. The Abbreviations: hcp: Hexagonal close-packed; fcc: Face-centered cubic.
Volume 2 Issue 1 (2025) 33 doi: 10.36922/ijamd.8291