
Page 309 - IJB-10-2
P. 309
International Journal of Bioprinting 3D-printed diabetic diet
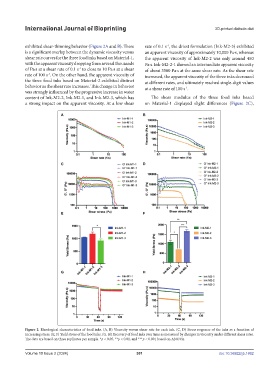
exhibited shear-thinning behavior (Figure 2A and B). There rate of 0.1 s , the driest formulation (Ink-M2-3) exhibited
-1
is a significant overlap between the dynamic viscosity versus an apparent viscosity of approximately 10,000 Pa·s, whereas
shear rate curves for the three food inks based on Material-1, the apparent viscosity of Ink-M2-2 was only around 450
with the apparent viscosity dropping from several thousands Pa·s. Ink-M2-2-1 showed an intermediate apparent viscosity
of Pa·s at a shear rate of 0.1 s to close to 10 Pa·s at a shear of about 3500 Pa·s at the same shear rate. As the shear rate
-1
rate of 100 s . On the other hand, the apparent viscosity of increased, the apparent viscosity of the three inks decreased
-1
the three food inks based on Material-2 exhibited distinct at different rates, and ultimately reached single-digit values
behavior as the shear rate increases. This change in behavior at a shear rate of 100 s .
-1
was strongly influenced by the progressive increase in water
content of Ink-M2-2, Ink-M2-1, and Ink-M2-3, which has The shear modulus of the three food inks based
a strong impact on the apparent viscosity. At a low shear on Material-1 displayed slight differences (Figure 2C),
Figure 2. Rheological characteristics of food inks. (A, B) Viscosity versus shear rate for each ink. (C, D) Stress response of the inks as a function of
increasing stress. (E, F) Yield stress of the food inks. (G, H) Recovery of food inks over time as measured by changes in viscosity under different shear rates.
The data are based on three replicates per sample. *p < 0.05, **p < 0.01, and ***p < 0.001 based on ANOVA.
Volume 10 Issue 2 (2024) 301 doi: 10.36922/ijb.1862