
Page 313 - IJB-10-2
P. 313
International Journal of Bioprinting 3D-printed diabetic diet
the five raw ingredients. FT-IR analysis provides insight 3.5. Regulation of blood glucose by food inks
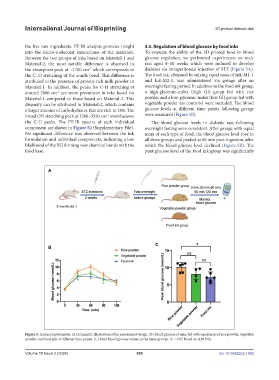
into the micro-molecular interactions of the materials. To evaluate the ability of the 3D-printed food in blood
Between the two groups of inks based on Material-1 and glucose regulation, we performed experiments on male
Material-2, the most notable difference is observed in rats aged 8–10 weeks which were induced to develop
the absorption peak at ~1700 cm which corresponds to diabetes via intraperitoneal injection of STZ (Figure 5A).
-1
the C=O stretching of the amide bond. This difference is The food ink, obtained by mixing equal mass of Ink-M1-1
attributed to the presence of protein-rich milk powder in and Ink-M2-1, was administered via gavage after an
Material-1. In addition, the peaks for C-H stretching at overnight fasting period. In addition to the food ink group,
-1
around 2800 cm are more prominent in inks based on a high-glycemic-index (high GI) group fed with rice
Material-1 compared to those based on Material-2. This powder and a low-glycemic-index (low GI) group fed with
disparity can be attributed to Material-2, which contains vegetable powder (as controls) were included. The blood
a larger amount of carbohydrates that are rich in OH. The glucose levels at different time points following gavage
broad OH stretching peak at 3200–3550 cm overshadows were measured (Figure 5B).
-1
the C-H peaks. The FT-IR spectra of each individual The blood glucose levels in diabetic rats following
component are shown in Figure S2 (Supplementary File). overnight fasting were consistent. After gavage with equal
No significant difference was observed between the ink mass of each type of food, the blood glucose level rose in
formulation and individual components, indicating a low all three groups and peaked at 60 min post-ingestion, after
likelihood of the XG forming new chemical bonds with the which the blood glucose level declined (Figure 5B). The
food base. peak glucose level of the food ink group was significantly
Figure 5. Animal experiments. (A) Schematic illustration of the experiment design. (B) Blood glucose of mice fed with equal mass of rice powder, vegetable
powder, and food ink at different time points. (C) Peak blood glucose values in the three groups. *p < 0.05 based on ANOVA.
Volume 10 Issue 2 (2024) 305 doi: 10.36922/ijb.1862