
Page 430 - IJB-10-2
P. 430
International Journal of Bioprinting In vitro 3D pancreatic acinar unit
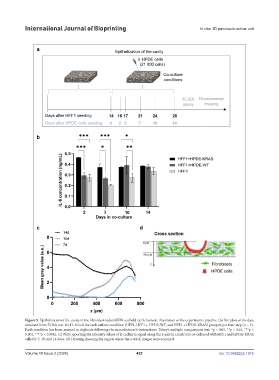
Figure 5. Epithelization of the cavity in the fibroblast-laden MEW scaffold. (a) Schematic illustration of the experiments pipeline. (b) Bar plots of the data
obtained from ELISA test for IL-6 level for each culture condition (HFF1, HFF1 + HPDE-WT, and HFF1 + HPDE-KRAS) grouped per time step (n = 3).
Each condition has been assayed in duplicate following the manufacturer’s instructions. Tukey’s multiple comparisons test: *p < 0.05, **p < 0.01, ***p <
0.001, ****p < 0.0001. (c) Plots reporting the intensity values of E-cadherin signal along the z-axis in constructs co-cultured with HFF1 and HPDE-KRAS
cells for 7, 10, and 14 days. (d) Drawing showing the region where the z-stack images were acquired.
Volume 10 Issue 2 (2024) 422 doi: 10.36922/ijb.1975