
Page 437 - IJB-10-4
P. 437
International Journal of Bioprinting Improving ductility of 3D-printed Zn–Mg
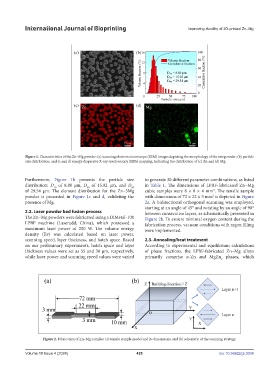
Figure 1. Characteristics of the Zn–Mg powder: (a) scanning electron microscope (SEM) images depicting the morphology of the raw powder; (b) particle
size distribution; and (c and d) energy-dispersive X-ray spectroscopy (EDS) mapping, indicating the distribution of (c) Zn and (d) Mg.
Furthermore, Figure 1b presents the particle size to generate 30 different parameter combinations, as listed
distribution: D of 8.80 μm, D of 15.02 μm, and D in Table 1. The dimensions of LPBF-fabricated Zn–Mg
10
50
90
of 29.54 μm. The element distribution for the Zn–3Mg cubic samples were 8 × 8 × 4 mm . The tensile sample
3
powder is presented in Figure 1c and d, validating the with dimensions of 72 × 22 × 3 mm is depicted in Figure
3
presence of Mg. 2a. A bidirectional orthogonal scanning was employed,
starting at an angle of 45° and rotating by an angle of 90°
2.2. Laser powder bed fusion process between consecutive layers, as schematically presented in
The Zn–Mg powders were fabricated using a DiMetal-100 Figure 2b. To ensure minimal oxygen content during the
LPBF machine (Laseradd, China), which possessed a fabrication process, vacuum conditions with argon filling
maximum laser power of 200 W. The volume energy were implemented.
density (Ev) was calculated based on laser power,
scanning speed, layer thickness, and hatch space. Based 2.3. Annealing/heat treatment
on our preliminary experiments, hatch space and layer According to experimental and equilibrium calculations
thickness values were set as 55 and 30 μm, respectively, of phase fractions, the LPBF-fabricated Zn–Mg alloys
while laser power and scanning speed values were varied primarily comprise α-Zn and MgZn phases, which
2
Figure 2. Fabrication of Zn–Mg samples: (a) tensile sample model and its dimensions, and (b) schematic of the scanning strategy.
Volume 10 Issue 4 (2024) 429 doi: 10.36922/ijb.3034