
Page 438 - IJB-10-4
P. 438
International Journal of Bioprinting Improving ductility of 3D-printed Zn–Mg
Table 1. Laser powder bed fusion (LPBF) process parameters These alloys exhibited relatively low tensile strength (100–
for printing Zn–Mg samples 120 MPa) and ductility (0.7–1%). Consequently, nine sets
of annealing/heat treatment parameters were designed,
Parameters Value involving different holding temperatures and durations at
Laser power (W) 50, 60, 70, 80, 90 three distinct temperatures (Figure 3b). A vacuum sintering
Scanning speed (mm/s) 400, 500, 600, 700, 800, 900 furnace (GJC-SJ300, Zhuzhou Guangjichang Technology
Hatch space (μm) 55 Co., Ltd., China) was employed for annealing after sanding
Layer thickness (μm) 30 all surfaces of the as-built Zn–Mg alloy samples. Each set
of annealing processes had a ramp rate of 10℃/min and
cooling with a furnace.
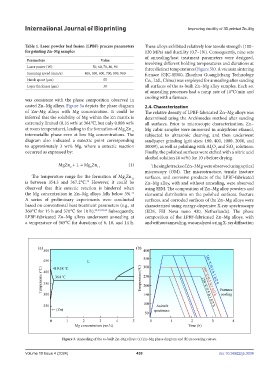
was consistent with the phase composition observed in
casted Zn–Mg alloys. Figure 3a depicts the phase diagram 2.4. Characterization
of Zn–Mg alloys with Mg concentration. It could be The relative density of LPBF-fabricated Zn–Mg alloys was
inferred that the solubility of Mg within the Zn matrix is determined using the Archimedes method after sanding
extremely limited (0.16 wt% at 364℃, but only 0.008 wt% all surfaces. Prior to microscopic characterization, Zn–
at room temperature), leading to the formation of Mg Zn Mg cubic samples were immersed in anhydrous ethanol,
11
2
intermetallic phase even at low Mg concentrations. The subjected to ultrasonic cleaning, and then underwent
diagram also indicated a eutectic point corresponding sandpaper grinding (grit sizes: 180, 400, 1000, 2000, and
to approximately 3 wt% Mg, where a eutectic reaction 3000#), as well as polishing with Al O and SiO solutions.
3
2
2
occurred as expressed by: Finally, the polished surfaces were etched with a nitric acid
alcohol solution (4 wt%) for 10 s before drying.
MgZn + L → Mg Zn (1) The single tracks of Zn–3Mg were observed using optical
2 2 11
microscopy (OM). The microstructure, tensile fracture
The temperature range for the formation of Mg Zn surfaces, and corrosive products of the LPBF-fabricated
2
11
29
is between 354.3 and 367.2℃. However, it could be Zn–Mg alloy, with and without annealing, were observed
observed that this eutectic reaction is hindered when using SEM. The composition of Zn–Mg alloy powders and
the Mg concentration in Zn–Mg alloys falls below 3%. elemental distribution on the polished surfaces, fracture
31
A series of preliminary experiments were conducted surfaces, and corroded surfaces of the Zn–Mg alloys were
based on conventional heat treatment parameters (e.g., at characterized using energy-dispersive X-ray spectroscopy
360℃ for 15 h and 370℃ for 10 h). 28,29,32,33 Subsequently, (EDS, FEI Nova nano 430, Netherlands). The phase
LPBF-fabricated Zn–Mg alloys underwent annealing at composition of the LPBF-fabricated Zn–Mg alloys, with
a temperature of 365℃ for durations of 6, 10, and 14 h. and without annealing, was analyzed using X-ray diffraction
Figure 3. Annealing of the as-built Zn–Mg alloys: (a) Zn–Mg phase diagram and (b) processing curves.
Volume 10 Issue 4 (2024) 430 doi: 10.36922/ijb.3034