
Page 506 - IJB-10-4
P. 506
International Journal of Bioprinting 3D-printed variable stiffness scaffolds
a preload of 0.01 N was applied at a rate of 0.01 mm/s and determine any significant differences for other parameters.
held for 30 s to ensure direct contact between the plate and Differences were considered significant at p < 0.05.
the construct. The cell-seeded rehydrated hydrogels were
compressed at a speed of 0.005 mm/s until 20% strain 3. Results and discussion
was reached. The strain was then held for 30 min. The 3.1. Microstructure of the native meniscus
compressive modulus was calculated from the initial linear One of the key issues in meniscus research is inconsistency
region of the stress–strain curve, and the compressive in the mechanical testing performed on the native
equilibrium modulus was determined by dividing the tissue. Studies are based on a variety of different testing
stress at the end of the cycle by the applied strain (20%).
conditions and criteria, with varying properties being
28
2.14. Statistical analysis reported. In this study, standard criteria for compressive
GraphPad Prism 8 (GraphPad Software, USA) was employed mechanical testing were followed, enabling a direct
for statistical analysis. Printing parameters (i.e., pressure comparison of the native meniscus and different scaffold
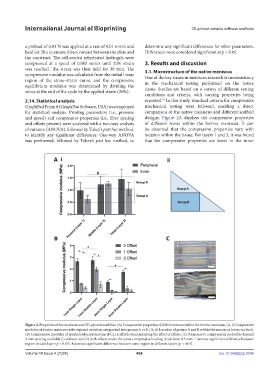
and speed) and compressive properties (i.e., fiber spacing designs. Figure 2A displays the compressive properties
and offsets present) were analyzed with a two-way analysis of different zones within the bovine meniscus. It can
of variance (ANOVA), followed by Tukey’s post hoc method, be observed that the compressive properties vary with
to identify any significant differences. One-way ANOVA location within the tissue. For layers 1 and 3, it was found
was performed, followed by Tukey’s post hoc method, to that the compressive properties are lower in the inner
Figure 2. Properties of the meniscus and 3D-printed scaffolds. (A) Compressive properties of different zones within the bovine meniscus. (A, i) Compressive
modulus of bovine meniscus with regional variation categorized into groups A or B. (A, ii) Location of groups A and B within the meniscus (cross-section).
(B) Compressive modulus of printed polycaprolactone (PCL) scaffolds demonstrating the effect of offsets. (C) Response to compression on double-layered
2 mm spacing scaffolds (i) without and (ii) with offsets under the same compressive loading. Scale bars: 0.5 mm. * denotes significant difference between
region in each layer (p < 0.05). # denotes significant difference between same region in different layers (p < 0.05).
Volume 10 Issue 4 (2024) 498 doi: 10.36922/ijb.3784