
Page 374 - IJB-10-5
P. 374
International Journal of Bioprinting Tunable anisotropic gyroid bioscaffolds
From Equations (II) and (III), the following equation although the values of ϕ are identical due to the same
can be obtained: C (x, y, z) control function, the change in γ value can
effectively tune the total surface area. This feature
C (x, y, z) = 0.02(x + y + z ) + 0.62 (IV) enables precise adjustment of the geometric properties
2
2
2
of the cellular structure, offering a wide range of
potential configurations.
where d represents the width or diameter of
the structure. Figure 2c illustrates the graded sheet 2.2. Preparation of 3D-printed green specimens
gyroid scaffolds with different γ value (γ.25-FGgy, The 3D printing was performed on a DLP printer (Admaflex
γ.33-FGgy, and γ.50-FGgy) and the corresponding 130, the Netherlands). The 3D printing process employed
porosity distribution within the scaffold. Computer- a commercial photosensitive silicon dioxide (SiO ) slurry
2
aided design (CAD) models for the gyroid (AdmaPrint S130, the Netherlands), which had a high
structures, including 40VF-gy, 50VF-gy, 60VF- ceramic loading exceeding 75 wt.% as confirmed by the
gy, 57.55VF-gy, γ.25-FGgy, γ.33-FGgy, and γ.50- thermogravimetric analysis (TGA) (Figure 3a). CAD
FGgy (Figure 2c), were generated using MSLattice. models of the sheet gyroid structures in STL format were
5
Table 1 summarizes the total surface area, ϕ, and imported into the built-in software and sliced for the
porosity of all gyroid structure. Besides ϕ, the total printing process. The layer thickness of 60 µm was set with
surface area of the structure is also affected by the γ an exposure intensity and time of 60 mW/cm and 2000
2
and C (x, y, z) values. For the graded gyroid structures, ms, respectively. After printing, the structures underwent
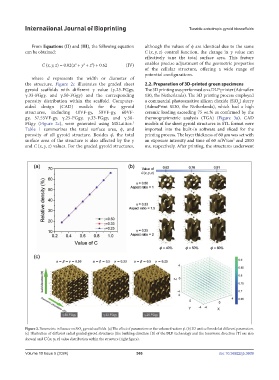
Figure 2. Parametric influence on SiO gyroid scaffolds. (a) The effect of parameters on the volume fraction ϕ. (b) 3D unit cell model at different parameters.
2
(c) Illustration of different radial graded gyroid structures (the building direction [B] of the DLP technology and the transverse direction [T] are also
shown) and C (x, y, z) value distribution within the structure (right figure).
Volume 10 Issue 5 (2024) 366 doi: 10.36922/ijb.3609