
Page 352 - IJB-10-6
P. 352
International Journal of Bioprinting Collagen hydrolysate-loaded ODMA/PEGDMA scaffold
Fisher, USA) according to the manufacturer’s instructions. 2.10. Statistical analysis
In brief, CSPCs were seeded on each scaffold at a density Statistical analyses were performed using GraphPad
of 5 × 10 cells/scaffold and cultured in a 24-well plate Prism version 9.0.0 (GraphPad Software, USA). Data are
4
containing DMEM complete medium at 37°C and in 5% expressed as mean ± standard deviation. The cell viability
CO for 24, 48, and 72 h, respectively. After reaching each (%) assays of fibroblasts treated with CH and human CSPCs
2
incubation period, each scaffold was then transferred cultured on different scaffolds were analyzed using one-
to a new well and incubated in a fresh culture medium way analysis of variance (ANOVA) and two-way analysis
®
containing 0.1% PrestoBlue in the dark for 1.5 h to assess of variance (two-way ANOVA), followed by the post hoc
®
cell metabolic activity. The medium containing PrestoBlue Tukey’s for multiple comparison tests, respectively. The
was then transferred into a 96-well plate in triplicate (100 statistical significance criterion was p < 0.05.
µL/well/sample). The absorbance was measured using a
microplate reader (Infinite 200 Pro; Tecan, Switzerland) at 3. Results and discussion
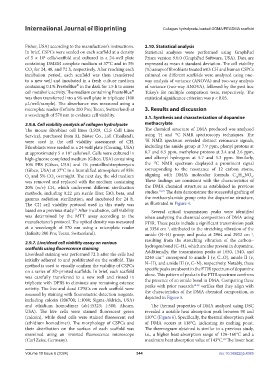
a wavelength of 570 nm to evaluate cell viability. 3.1. Synthesis and characterization of dopamine
2.9.6. Cell viability analysis of collagen hydrolysate methacrylate
The mouse fibroblast cell lines (L929, CLS Cell Lines The chemical structure of DMA produced was analyzed
13
1
Service), purchased from XL Biotec Co., Ltd. (Thailand), using H and C NMR spectroscopy techniques. The
were used in the cell viability assessment of CH. 1 H NMR spectrum revealed distinct resonance signals,
Fibroblasts were seeded in a 24-well plate (Corning, USA) including the amide group at 7.9 ppm, phenyl protons at
at approximately 5 × 10 cells/well. Cells were cultured in 6.7 and 6.5 ppm, methylene protons at 3.4 and 2.6 ppm,
4
high-glucose completed medium (Gibco, USA) containing and alkenyl hydrogens at 5.7 and 5.3 ppm. Similarly,
13
10% FBS (Gibco, USA) and 1% penicillin/streptomycin the C NMR spectrum displayed a prominent signal
(Gibco, USA) at 37°C in a humidified atmosphere of 95% corresponding to the resonance of 12 carbon atoms,
O and 5% CO overnight. The next day, the old medium aligning with DMA’s molecular formula C H NO .
12
3
15
2
2
was removed and replaced with the medium containing These findings are consistent with the characteristics of
20% (w/v) CH, which underwent different sterilization the DMA chemical structure as established in previous
methods, including 0.22 µm sterile filter, EtO, beta, and studies. 10,22 The data demonstrate the successful grafting of
gamma radiation sterilization, and incubated for 24 h. the methacrylamide group onto the dopamine structure,
The CH cell viability protocol used in this study was as illustrated in Figure 4.
based on a previous study. After incubation, cell viability Several critical transmission peaks were identified
21
was determined by the MTT assay according to the when analyzing the chemical composition of DMA using
manufacturer’s protocol. The optical density was measured FTIR. These peaks include a significant transmission peak
at a wavelength of 570 nm using a microplate reader at 3354 cm , attributed to the stretching vibration of the
−1
(Infinite 200 Pro; Tecan, Switzerland). amide (N–H) group; and peaks at 2964 and 2932 cm ,
−1
2.9.7. Live/dead cell viability assay on various resulting from the stretching vibration of the carbon–
scaffolds using fluorescence staining hydrogen bond (C–H), which are also present in dopamine.
Live/dead staining was performed 72 h after the cells had Additionally, the transmission peaks at 1650, 1540, and
−1
initially adhered to and proliferated on the scaffold. This 1240 cm correspond to amide I (ν, C=O), amide II (ν,
N−H), and amide III (ν, C–N), respectively. Notably, these
method is used to visually confirm the viability of CSPCs
on a series of 3D-printed scaffolds. In brief, each scaffold specific peaks are absent in the FTIR spectrum of dopamine
was carefully transferred to a new well and rinsed in alone. This pattern of peaks in the FTIR spectrum confirms
triplicate with DPBS to eliminate any remaining esterase the presence of an amide bond in DMA. Comparing these
10,22
activity. The live and dead CPSCs on each scaffold were peaks with prior research verifies that they align with
assessed by staining with fluorometric detection reagents, the characteristics of the DMA chemical composition, as
depicted in Figure 5.
including calcein (206700; 1:1000; Sigma-Aldrich, USA)
and ethidium homodimer (ab145323; 1:500; Abcam, The thermal properties of DMA analyzed using DSC
USA). The live cells were stained fluorescent green revealed a notable heat absorption peak between 90 and
(calcein), while dead cells were stained fluorescent red 130°C (Figure 6). Specifically, the thermal absorption peak
(ethidium homodimer). The morphology of CSPCs and of DMA occurs at 118°C, indicating its melting point.
their distribution on the surface of each scaffold was The thermogram obtained is similar to a previous study,
examined using an inverted fluorescence microscope i.e., a higher heat absorption range of 120–160°C and a
(Carl Zeiss, Germany). maximum heat absorption value of 143°C. The lower heat
22
Volume 10 Issue 6 (2024) 344 doi: 10.36922/ijb.4385